Solution Sketch Exam 2 
Bear, P. Olar
BRRRRRRRR
Purpose :
Demonstrate ability to apply hydrologic and problem solving principles with respect to hydrologic abstractions, specific loss models, and hydrograph timing parameters.
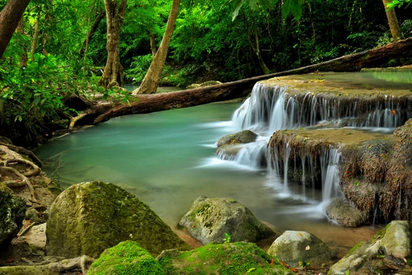
Problem 1 Time of Concentration
Figure 1 is a watershed.
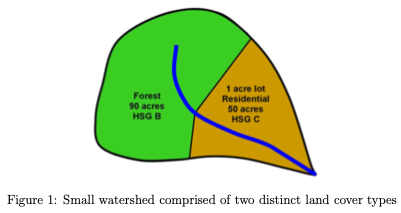
The forest portion has a flow path length of 360 feet, at an average slope of 0.01 (1%) until it reaches the residential portion whose path length is 430 feet, at an average slope of 0.005 (0.5%).
Estimate the time of concentration using the NRCS-Upland method.
Solution
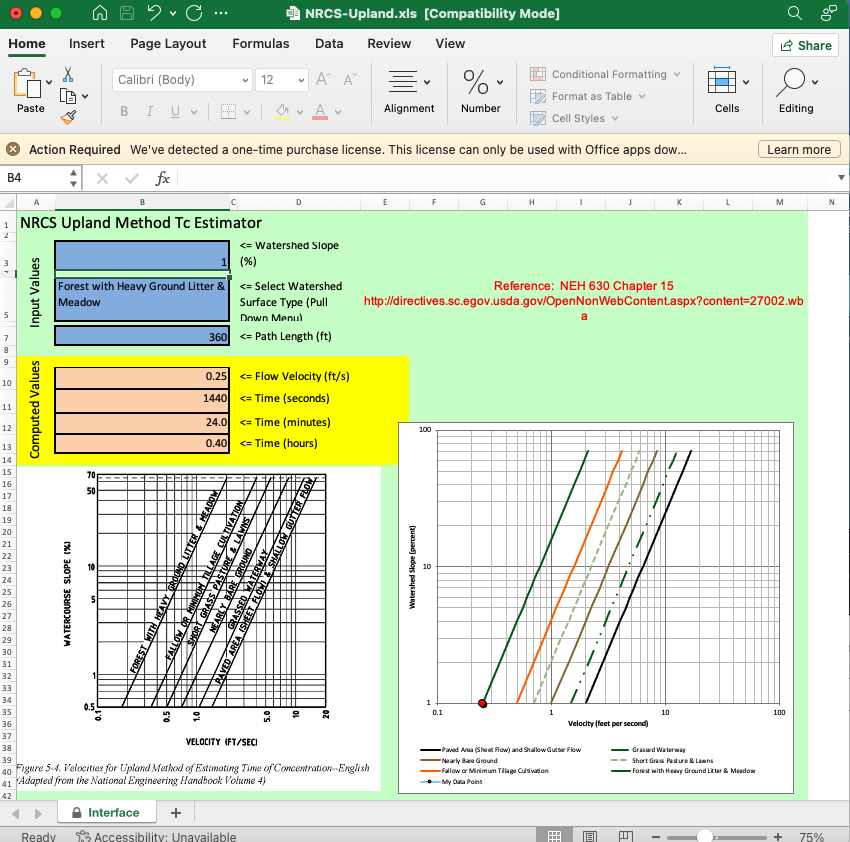
Apply NRCS method
Forest portion
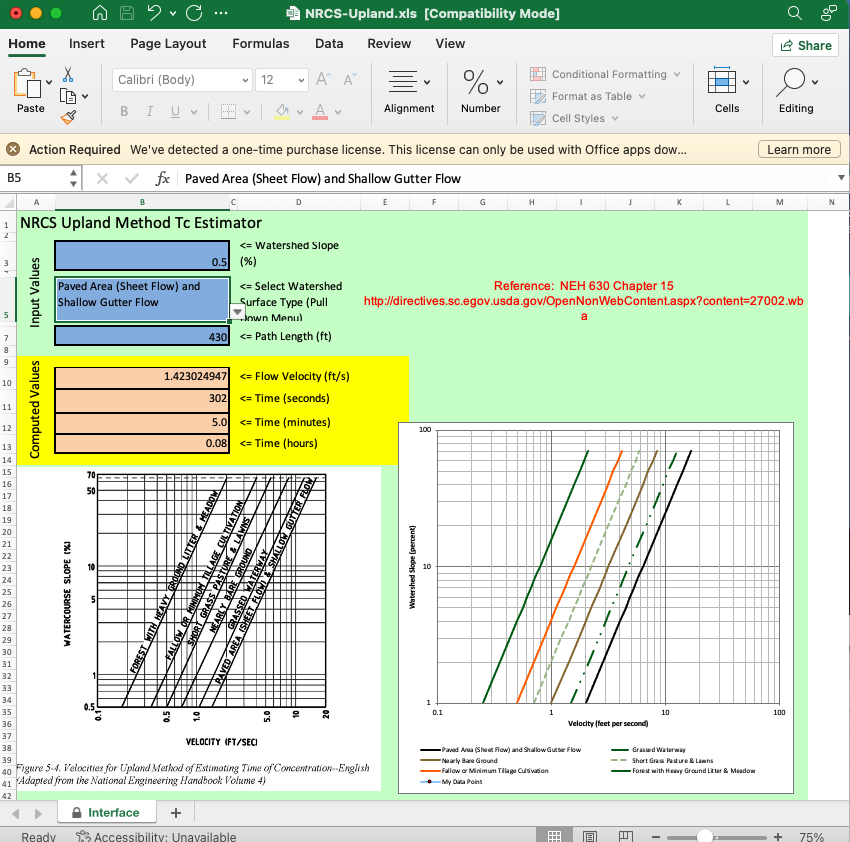
Resedential portion
Then compute times as sum of the two parts.
# solution here
Lforest = 360
Lresid = 430
Vforest = 0.25
Vresid = 1.423
Tforest = Lforest/Vforest
Tresid = Lresid/Vresid
print(round((Tforest+Tresid)/60,1), "minutes")
29.0 minutes
Problem 2 Time of Concentration for Hardin Creek Watershed(s)
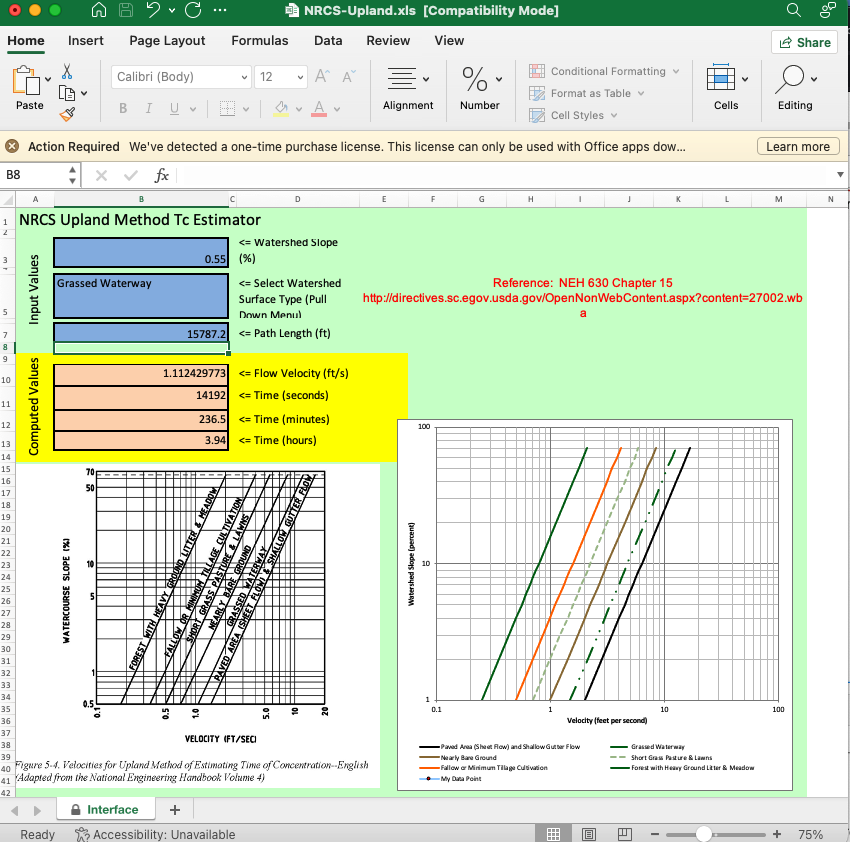
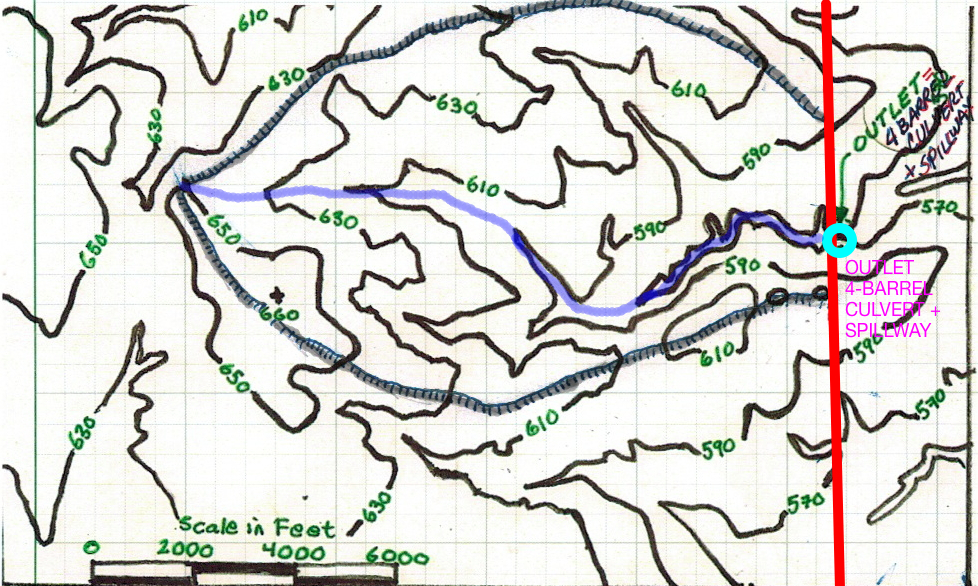
Figure 2 below is the Hardin Creek study area, already delineated with three sub-basins identified.
Estimate the time of concentration using the NRCS-Upland method for the Harden Creek watersheds (each sub-basin to reservoir riser pipe, and the portion downstream of the reservoirs directly to the study point of interest).
Solution
Summarize your results in the table below:
Sub-Basin |
Area (sq. mi.) |
Time of Concentration (minutes) |
|---|---|---|
North Basin |
3.83 |
311 |
West Basin |
6.04 |
478 |
Eden Basin |
6.95 |
285 |
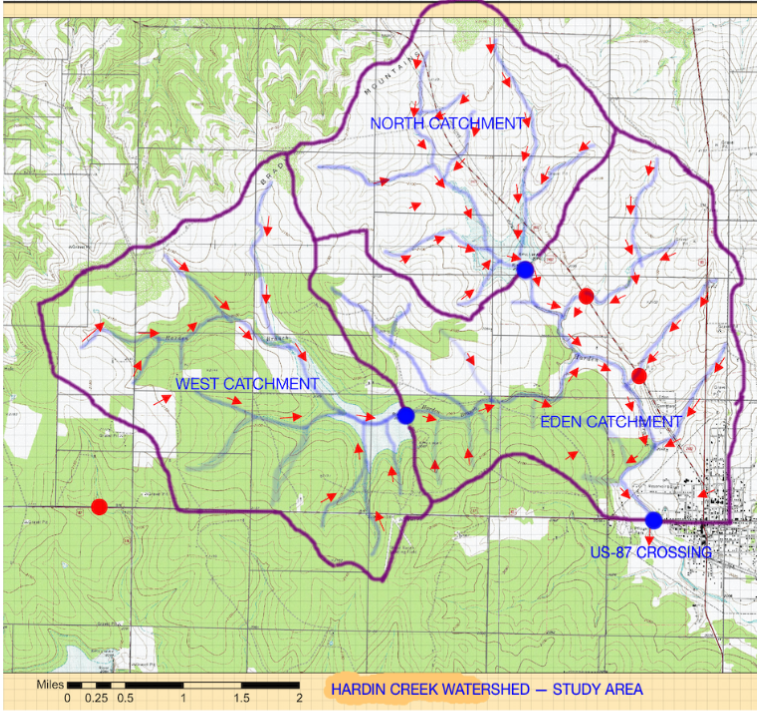
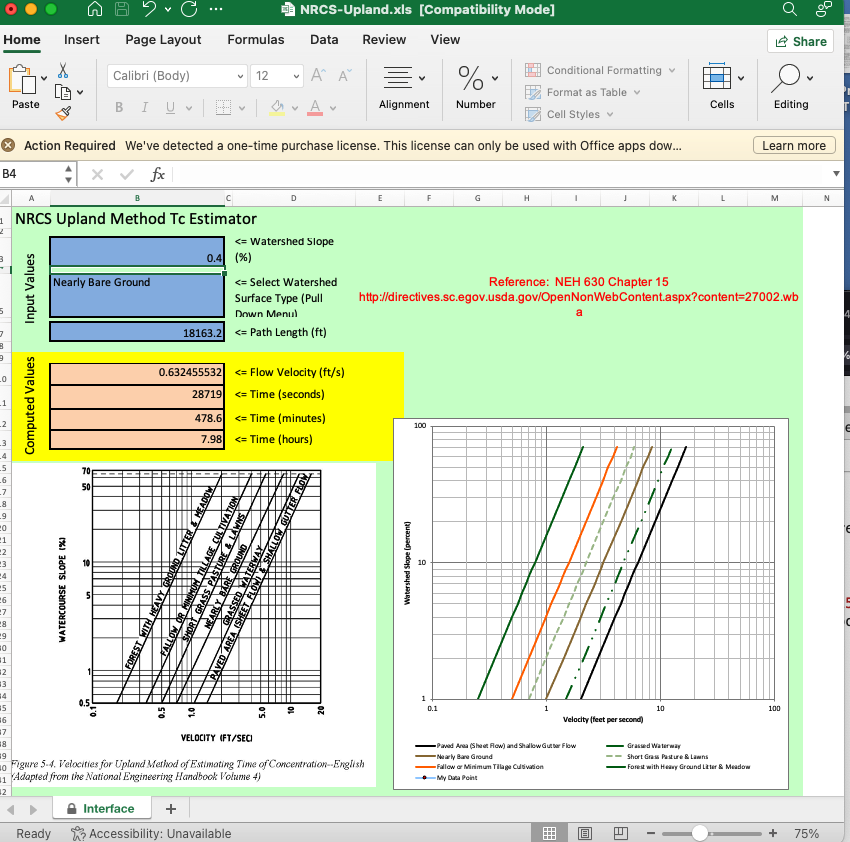
Use NRCS Upland to get travel times (assume is is the Tc)
North Catchment to reservoir outlet

West Catchment to reservoir outlet
Eden Catchment to US87 outlet
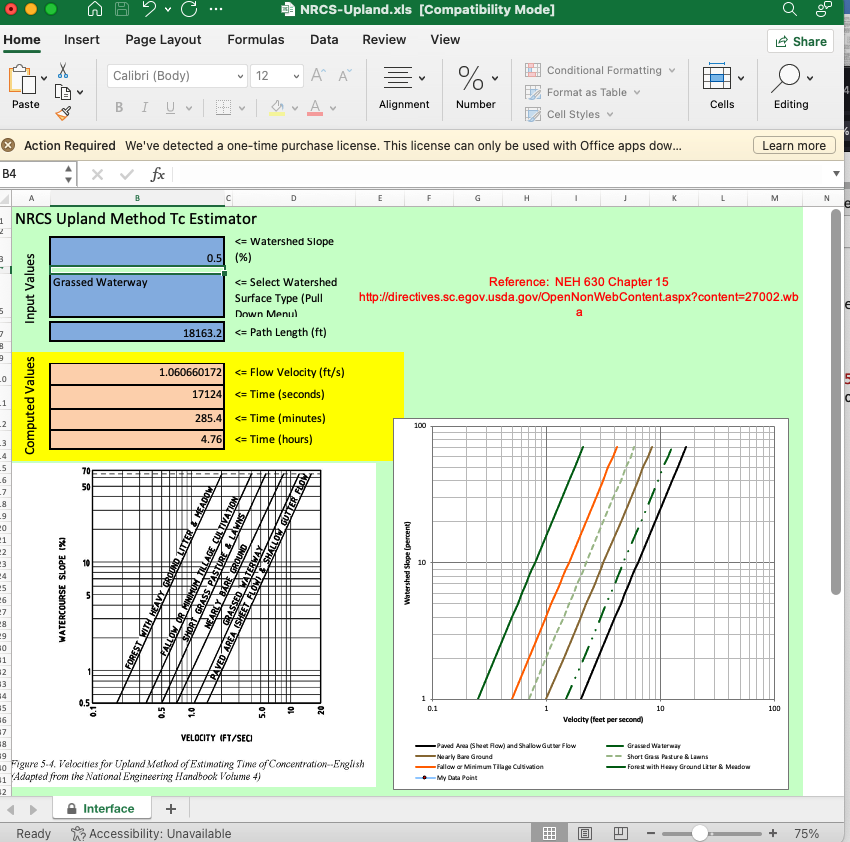
Stream from North Reservoir outlet to US87
Stream from West Reservoir outlet to US87

Item |
Distance to outlet (miles) |
Slope |
NRCS Travel time(minutes) |
|---|---|---|---|
North Catchment to Reservoir Outlet |
2.74 |
0.006 |
311 |
West Catchment to Reservoir Outlet |
3.44 |
0.004 |
478 |
Eden Catchment to US 87 Crossing |
3.69 |
0.005 |
285 |
West Reservoir Outlet to US 87 Crossing |
3.62 |
0.0045 |
316 |
North Reservoir Outlet to US 87 Crossing |
2.99 |
0.0055 |
236 |
# solution here
Problem 3. Loss Models
A tabulation of an observed storm and associated runoff for the drainage area are listed below. The runoff was measured at the culvert system and indicated by the blue circle on the map.
Time (hrs) |
Accumulated Rain (inches) |
Observed Discharge (cfs) |
Incremental Volume (ft\(^3\)) |
Cumulative Volume (ft\(^3\)) |
|---|---|---|---|---|
0 |
0.000 |
0.00 |
||
1 |
0.000 |
0.00 |
||
2 |
0.000 |
0.00 |
||
3 |
0.000 |
0.00 |
||
4 |
0.000 |
0.00 |
||
5 |
0.000 |
0.00 |
||
6 |
0.000 |
0.00 |
||
7 |
0.000 |
0.00 |
||
8 |
0.101 |
1.40 |
||
9 |
0.106 |
0.31 |
||
10 |
0.111 |
0.31 |
||
11 |
0.115 |
0.31 |
||
12 |
0.120 |
0.31 |
||
13 |
0.120 |
0.40 |
||
14 |
0.150 |
0.40 |
||
15 |
0.750 |
24.66 |
||
16 |
2.750 |
588.23 |
||
17 |
2.940 |
808.70 |
||
18 |
3.030 |
154.28 |
||
19 |
3.030 |
94.68 |
||
20 |
3.030 |
27.56 |
||
21 |
3.090 |
36.13 |
||
22 |
3.210 |
19.65 |
||
23 |
3.300 |
7.00 |
||
24 |
3.300 |
0.00 |
Determine
The loss from the raw precipitation input to the watershed.
An appropriate CN for the watershed supported by the tabulated data.
The maximum retention S for the watershed supported by the tabulated data.
# solution here

time = [0,
1,
2,
3,
4,
5,
6,
7,
8,
9,
10,
11,
12,
13,
14,
15,
16,
17,
18,
19,
20,
21,
22,
23,
24
]
acc_rain =[ 0,
0,
0,
0,
0,
0,
0,
0,
0.101,
0.106,
0.111,
0.115,
0.12,
0.12,
0.15,
0.75,
2.75,
2.94,
3.03,
3.03,
3.03,
3.09,
3.21,
3.3,
3.3
]
inc_disc =[ 0,
0,
0,
0,
0,
0,
0,
0,
1.4,
0.31,
0.31,
0.31,
0.31,
0.4,
0.4,
24.66,
588.23,
808.7,
154.28,
94.68,
27.56,
36.13,
19.65,
7,
0
]

acc_disc = [0 for i in range(len(inc_disc))]
for i in range(1,len(inc_disc)):
    acc_disc[i] =0.5*(inc_disc[i]+inc_disc[i-1])*3600 + acc_disc[i-1]

Area = 88711200 #ft^2 From Exam 1 or redo the calculations
P = acc_rain[len(acc_rain)-1]
Q = 12*(acc_disc[len(acc_disc)-1]/Area) # wtaershed inches
Loss = P - Q


#trial and error to find S that agrees with observations

S = 4.4  # trial and error this value
Qscs = (P-0.2*S)**2/(P+0.8*S)

print("Q_error ",round(Qscs-Q,3),"\n")
# now recover CN and report results

CN = 1000/(S+10)

print("Loss ",round(Loss,3)," watershed inches")
print("CN based on tabulated values ",round(CN,0))
print("Maximum Retention S ",round(S,3))
Q_error  -0.0

Loss  2.441  watershed inches
CN based on tabulated values  69.0
Maximum Retention S  4.4
Problem 4. Evapotranspiration Models
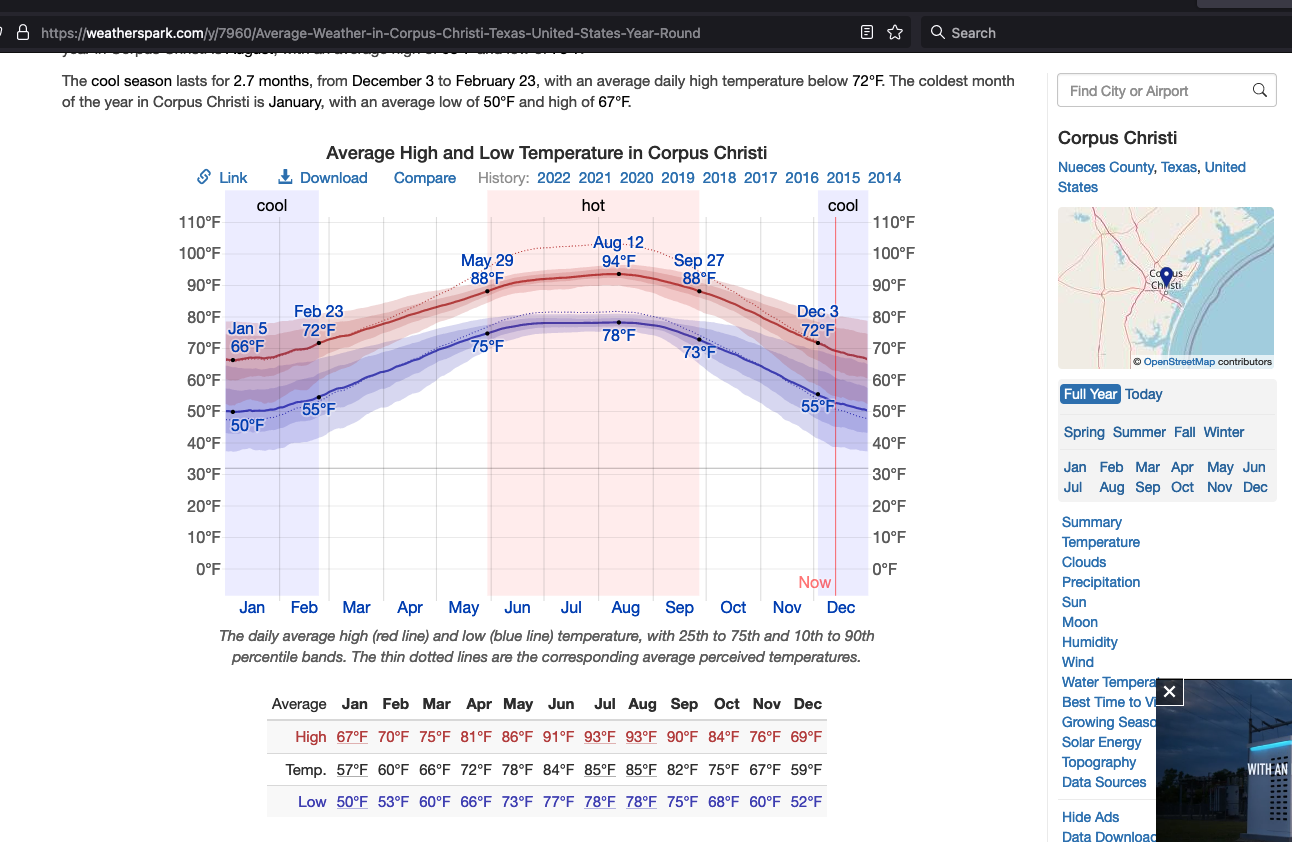
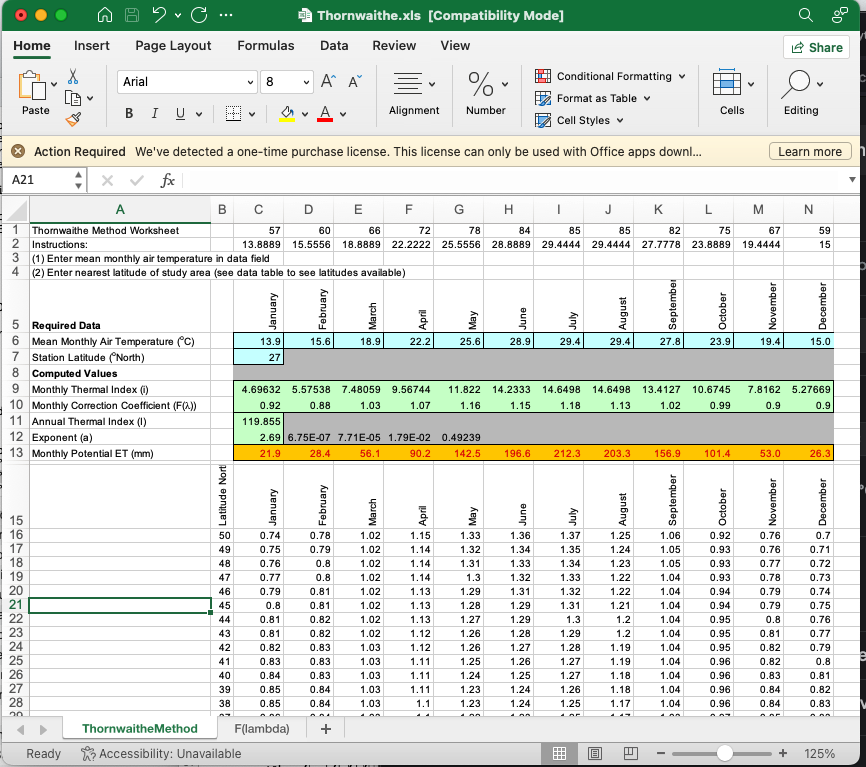
Estimate the monthly evapotranspiration depths for the Corpus Christi (Nueces County) area using the Thornwaithe method.
Repeat the process using the Blaney-Criddle method for the same geographic area.
Compare the results to the values reported at https://waterdatafortexas.org/lake-evaporation-rainfall. Corpus Christi is in Cell 911 and Cell 1010 in the map shown at this website, choose either cell for your comparison.
Solution
Need Temperature information
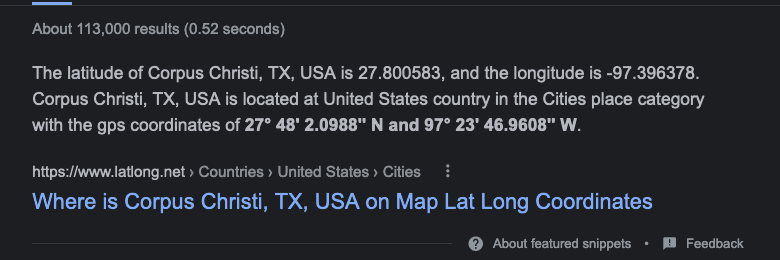
Need location information
Apply Thornwaithe
Apply Blaney-Criddle

# solution here