3. Watersheds
Course Website
Description of watersheds in terms of hydrologic response and function. Discuss how to delineate watersheds using various tools.
Readings
Brutsaert, W., 2005, Hydrology: An Introduction. Cambridge University Press
Chow, V.T., Maidment, D.R., Mays, L.W., 1988, Applied Hydrology. New York, McGraw-Hill.
Florida Delineation Training Watershed (png) Right-Click “Save As…”
Texas Delineation Training Watershed (png) Right-Click “Save As…”
Videos
Outline
What is a watershed?
Delineating a Watershed
Important Watershed Metrics
What is a Watershed?
Some definitions of a watershed include:
Topographic area that collects and discharges surface streamflow through one outlet or mouth (pour point)
The area on the surface of the Earth that drains to a specific location
In groundwater a similar concept is called a groundwater basin – only the boundaries can move depending on relative rates of recharge and discharge
The topographic definition omits that there could be subsurface sewer systems that can cross topographic boundaries.
It’s a big deal in urban areas.
Consider the artist rendering of a watershed
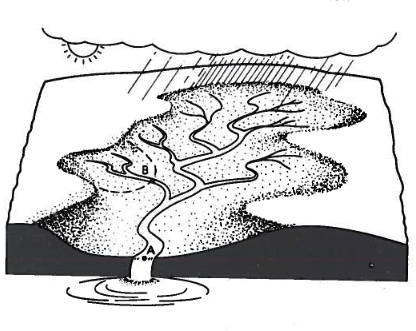
Large watersheds are comprised of smaller interconnected watersheds.
Delineating a Watershed
Watershed delineation is a fundamental process in hydrology and environmental science that involves defining the boundaries of a drainage area or catchment. It identifies the geographic area from which all precipitation and surface runoff flow into a single outlet, typically a river, stream, or lake.
This analytical method is typically employed:
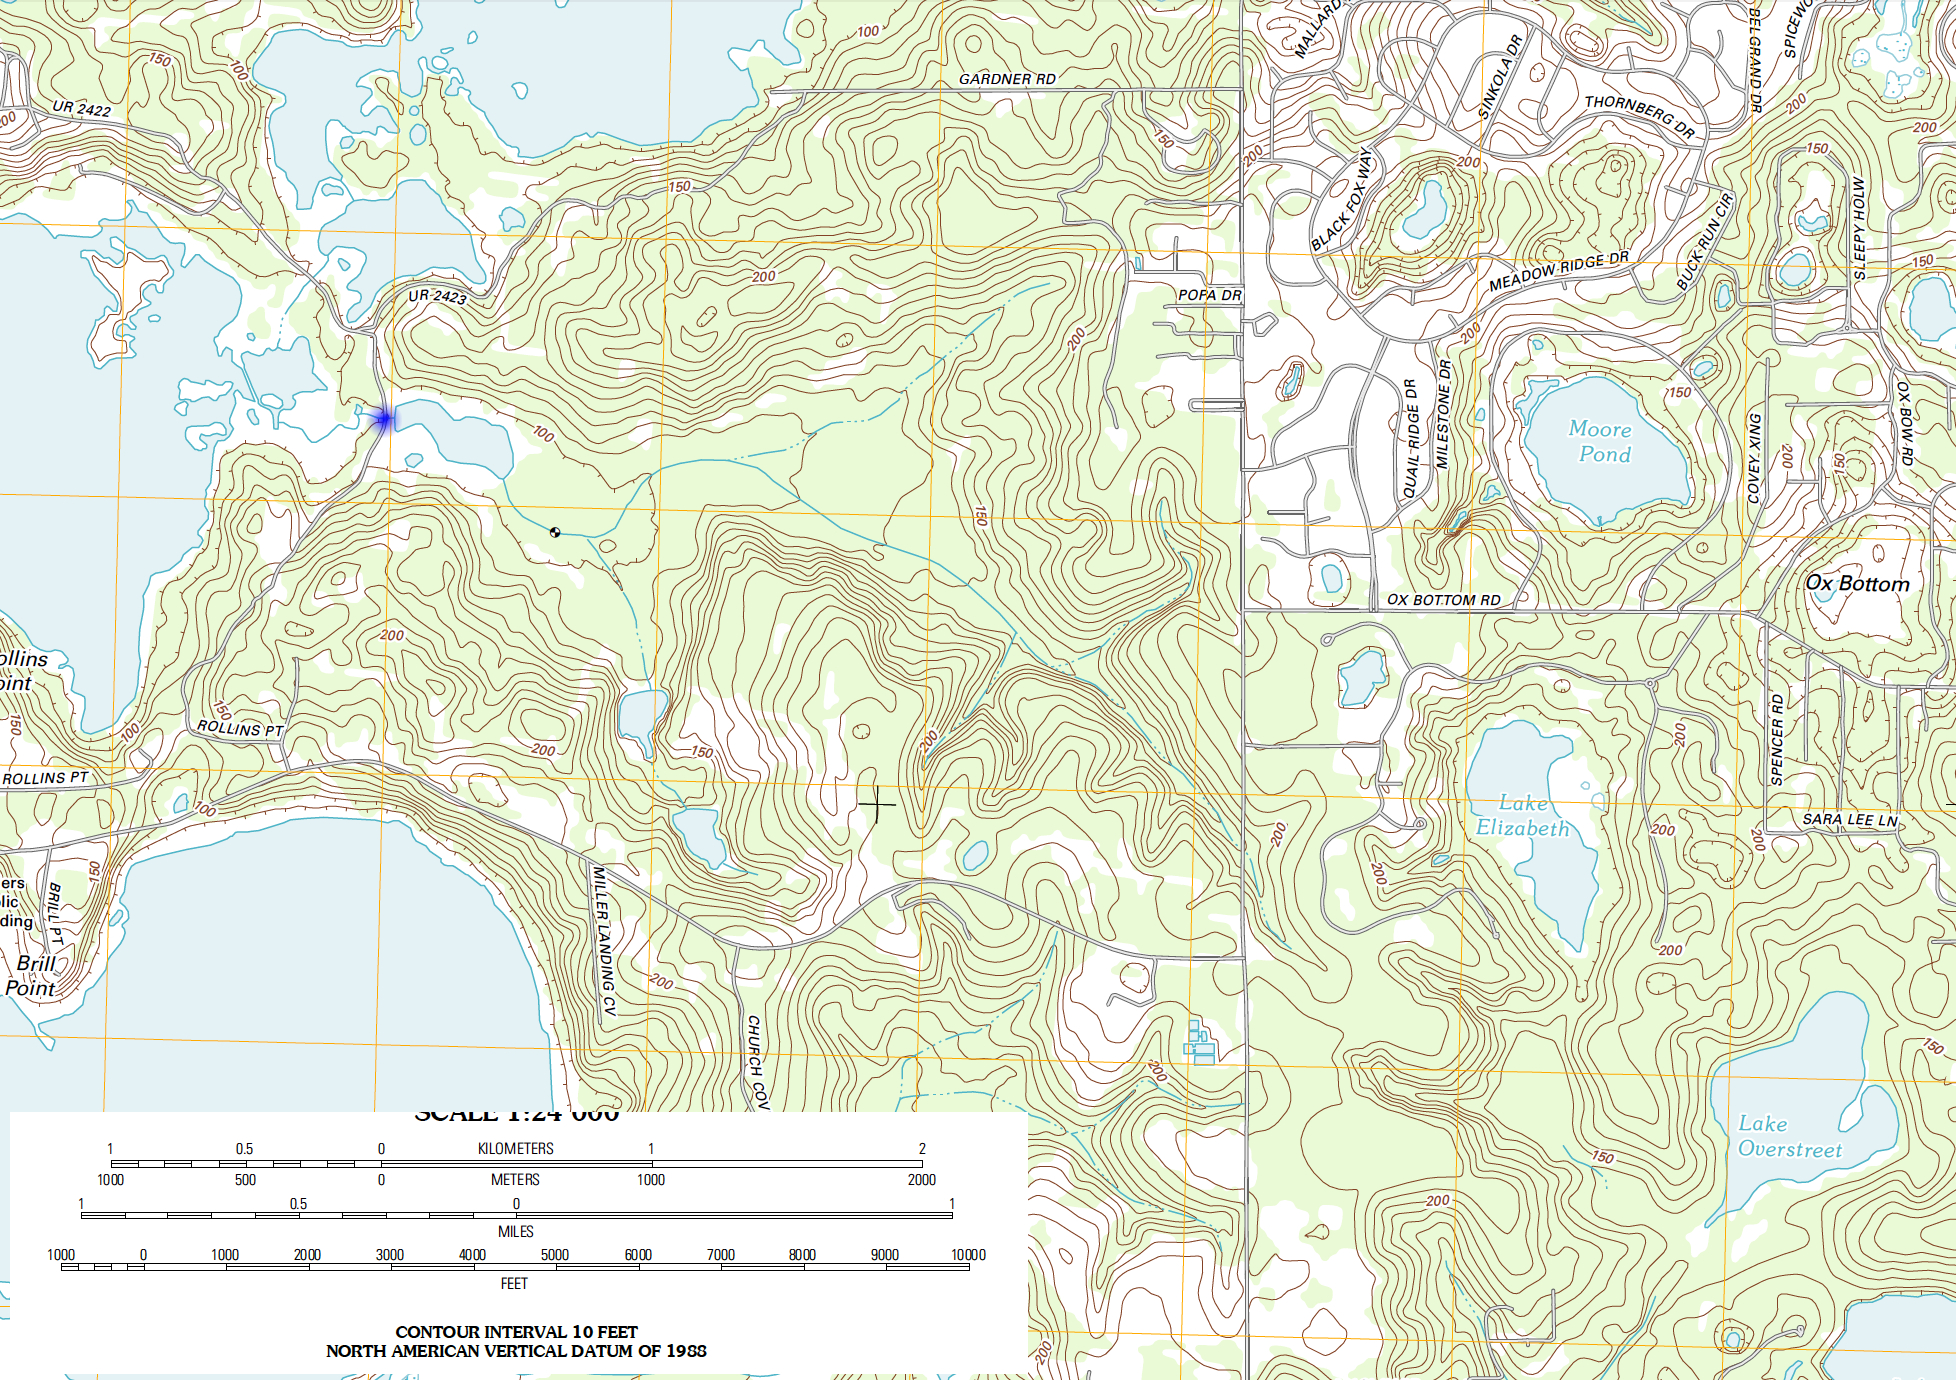
By-hand using paper or digital maps (see example below)
Semi-automated using digital maps (see example below)
Fully-automated using digital elevation data and geographic information systems (GIS)
In all three cases above the goal is to trace the flow of water and determine the contributing area to a specific point of interest. Watershed delineation plays a crucial role in various applications, including flood management, water resource planning, and environmental conservation, by providing a spatial framework to understand and manage water-related processes within a defined geographic region.
Watershed Metrics
Once a watershed is identified and demarked we can measure a few commonly used and important physical properties. These measurements are used are to characterize the fundamental unit in surface water hydrology which is the watershed.
A watershed is defined as the area on the surface of the earth that drains to a specific location.
A minimal description of watershed properties must include:
Area
Main channel length
Slope (requires the specification of path), The MCS is usually reported as is the average slope (highest point on the boundary to the pour point). The transverse slope is often reported too.
Soil permeability
%-impervious (developed)
Measuring Area
If the grid cells used in delineation are all squares, one can count the squares contained in the watershed, multiply by the per-cell area and have a good estimate of the watershed area.
Or one can represent the outline as a polygon, and obtain the coordinates of each vertex and use numerical integration (like you learned in surveying) to estimate the plane area.
Or capture an image for the map with the boundary, and import it into a graphics program and use the measuring tools (Acrobat Pro, AutoCAD, Engauge, ArcGIS, QGIS, …. )
Measuring Length(s)
Similar to area, you can count cells along a path and multiply the count by the length of a cell side, or the cell diagonal (depends on how many diagonal moves you need to make) to obtain a length. Or use software (Acrobat Pro, AutoCAD, Engauge, ArcGIS, QGIS, …. ) to make the measurements.
Estimating Slope(s)
Slope estimates require two components
A path with a length (\(S\))
The change in elevation along the path (\(\Delta z\))
The dimensionless slope is simply the ratio of the two \(\frac{\Delta z}{S}\). Percent slope is the dimensionless slope multiplied by 100. Sometimes slope is expressed in units of \(\frac{ft}{mi}\) or \(\frac{m}{km}\), while meaningful these will have to be converted into dimensionless or %-slope for most hydrologic computations.
Estimating Soil Properties
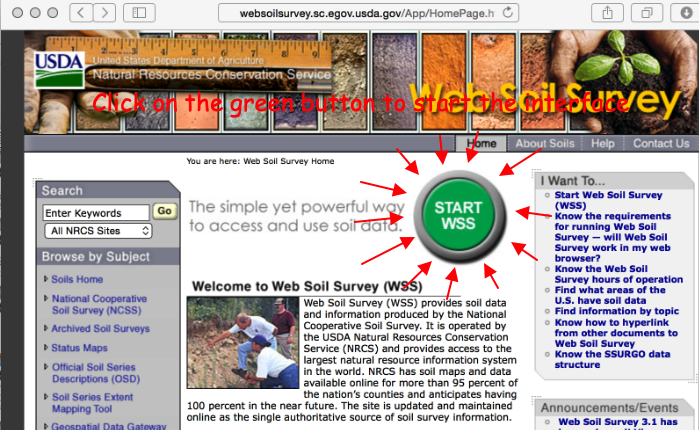
Subjective when using paper maps, but reasonable values can be inferred from soil maps - either paper-based or electronic Web Soil Survey
Estimating %-Impervious
This is subjective, but one reasonable approach is using Google Earth
Find the area of interest
Select a viewing height (needs to be same for all areas if you are going to have to scroll)
Put a grid on the screen (physical grid on see‐thru plastic, or use a china marker and draw on the screen)
Count concrete vs not concrete – relative ratio is a useable estimate of the % impervious
Note
This would be a good task to hand off to a machine learner model. Take the area of interest, capture an image, have the ML model count pixels that are NOT CONCRETE (brown, green, …..)
Self-Study Tasks:
Explain the significance of a delineated watershed in the context of a study area.
Discuss how watershed boundaries could impact hydrological processes and management.