Lab 5. - Fitting Losses#
Course Website
Readings#
Videos#
Energy Losses in Pipes - Hydraulics Series by Bogart Alcala The appratus is similar to our TTU set-up.
Objective(s)#
The objective of this experiment is to investigate minor losses in pipe fittings, including bends, sudden expansions, and sudden contractions. Specifically, the experiment aims to:
Measure and compare pressure drops across different fittings to determine their respective loss coefficients (KK).
Evaluate the relationship between pressure losses and flow velocity through various fittings.
Develop hands-on experience with data acquisition techniques, including manual flow rate measurements and the use of a Raspberry Pi-based flowmeter.
Explore how geometric factors, such as the ratio of radius of curvature to pipe diameter (R/DR/D) and area changes (AuAu and AdAd), affect loss coefficients.
Validate experimental findings by comparing measured loss coefficients to standard tabulated values reported in the literature.
Encourage critical thinking by requiring:
Justifcation the omission of one fitting pair if using a limited number of pressure transducers.
Analyze the effects of flow regime and measurement uncertainties on experimental results.
Background#
Pipe networks have numerous fittings: mitre bends, elbow bends, large radius bends, sudden expansions and sudden contractions. There are losses due to these fittings which are known as fitting or minor losses which cause noticable pressure drops. Pressure loss across a fitting is the difference between the pressure at the upstream and downstream of that fitting.
Expansions and Contractions#
In a sudden expansion, the flow splits when it is entering the bigger diameter pipe from the smaller diameter pipe. Head is lost due to the diffusion and eddies in the corners. In sudden contraction, flow area is contracted which is known as vena contracta because of the jet formation. Head loss is due to vortices and eddies. Figure 1 illustrates loss at a pipe fitting:
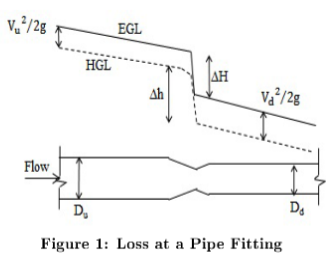
For the fitting above, the total head loss:
The loss coefficient K is defined as
or
Usually the velocity associated with the smaller diameter part of the fitting is used.
In this experiment, the mitre and elbow have constant pipe diameters. Therefore, \(V_u\) and \(V_d\) are the same.
For the sudden enlargement, the upstream velocity is used to express the velocity head. For the sudden contraction, the downstream velocity characterizes the velocity head.
Bends#
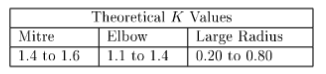
When liquid is flowing through a \(90^o\) bend, depending on the ratio of radius of curvature to diameter of the pipe (\(\frac{R}{D}\)), amount of loss differs. Smaller loss is associated with easier flow path and lower the minor loss coefficient, K value is. Following table summarizes the typical K values for different bends
Loss Model Structure#
The loss model(s) are usually of the structure
where the velocity is taken as the larger value in the case of a diameter change.
The \(K\) values are determined from
Bend#
Expansion#
The \(K\) value can be approximated from
Contraction#
The \(K\) value can be approximated from
Apparatus Layout and Operation#
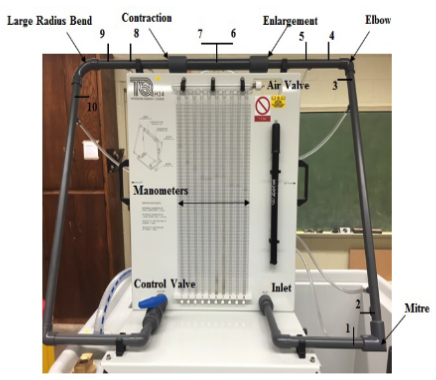
The figure depicts the experimental apparatus used. The operational procedure is:
Close the exit valve on the left side of the flow circuit, and then turn on the water source
Slowly open the exit valve on the apparatus, and watch the water levels in the manometer tubes
Determine the flow rate of the liquid by measuring the time it takes to fill a known volume, and using the homebrew flowmeter (Raspberry Pi)
Record the differential pressure readings across each of the fittings
Repeat step 3 and 4 to obtain data for at least five different flow rates by adjusting the exit valve
Note
If pressure taps are available in time, we will add the pressure transducer/Raspberry Pi datalogger into the above general procedure. With only 8 input channels one fitting pair will be omitted - study the apparatus and determine and justify which pair can be omitted and still obtain adequate information.
Deliverables#
Warning
This laboratory will not have a sample protocol, or sample report; here you are truly on your own.
Develop an experimental protocol (step-by-step instructions) to measure flow (two methods) and pressure drop (two methods), across the various fittings. Submit in advance for safety approval - the protocol becomes part of your laboratory report.
Laboratory Report documenting the actual experiments, and other required content including comparison to tabulated values.