ENGR 1330 – Computational Thinking and Data Science - Spring 2022
Introduction: Pressure Transducer Calibration
Measurement is a process of comparison: the measured quantity is compared to a known standard. Before we measure, we must establish the relationship between the readout val-ues of our instrument and known input values of the measurand. This process is called as calibration.
The purpose of calibrating a system is to:
- Relate the actual sensor output (i.e. a voltage) to the quantity we are attempting to measure ($\frac{F}{A}$ a normal stress, we usually call pressure)
- Identify and correct bias error
- Quantify random error associated with using each system.
This project will develop scripts to calibrate two independent pressure measurement systems:
- an analog gauge and
- an electronic pressure transducer
The pressures produced by the tester as shown by the values stamped on the weights as the exact true pressures. The true pressure, the pressure indicated on the analog gauge, and the voltage output by the pressure transducer are given to you, respectively.
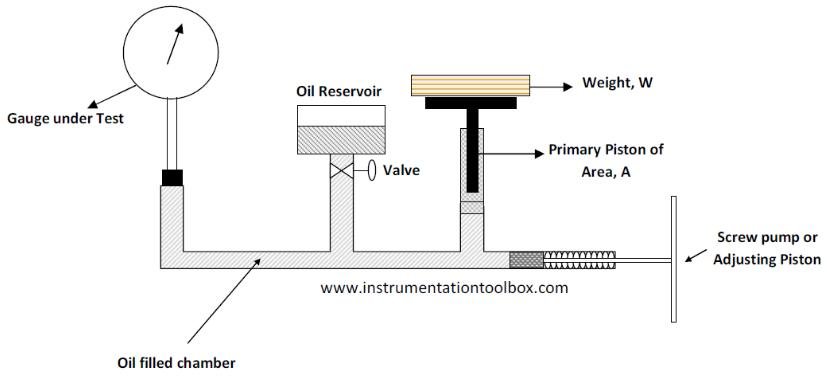
The figure below shows a picture of a typical deadweight tester instrument.

An operational schematic is shown in the following figure
Learn More at http://54.243.252.9/engr-1330-webroot/6-Projects/P-InstrumentCalibration/Calibrationho.pdf
Objective(s):
- Literature scan on instrument calibration and pressure measurement techniques
- Analyse an existing measurement database and build a data model to calibrate a pressure transducer, and an analog gage. The measurements database is comprised of 4 columns:
- A test ID (in practice replicate tests are conducted. Why?)
- The true applied pressures from 5 psig to 105 psig.
- The analog pressures read from the gauge.
- The voltages read from the transducer.
- Build an interface to allow users to enter voltages and return an estimated pressure and an assessment of the uncertainty in the estimate, and return the anticipated analog reading.
- Build an interface to allow users to add observations to the underlying database, and automatically update the calibration model to incorporate the new observations
Tasks:
Literature Research:
- Describe the proces of pressure transducer calibration using a deadweight testbed (i.e. provide a description for the schematic figure above)
- Summarize the value of a calibration (data) model in the context of converting voltage readings to applied pressure.
Some places to start
Beckwith, Marangoni, and Lienhard, Mechanical Measurements, Fifth Edition, Addison-Wesley PublishingCo., Reading, Massachusetts, 1993.
Bevington and Robinson, Data Reduction and Error Analysis for the Physical Sciences, Second Edition,WCB/McGraw Hill, Boston, Massachusetts, 1992.
Meyer, Paul L., Introductory Probability and Statistical Applications, 2nd Edition, Addison-WesleyPublishing Co., Reading, Massachusetts, 1970
Kline, S. J. and F. A. McClintock (1953). Describing uncertainties in single-sample experiments. Mechanical Engineering (No. 75), 3-9. http://54.243.252.9/engr-1330-webroot/6-Projects/P-InstrumentCalibration/Kline_McClintock1953.pdf
Holman, J. P. (1989). Experimental Methods for Engineers, 5th Edition. New York, NY: McGraw-Hill. http://54.243.252.9/engr-1330-webroot/6-Projects/P-InstrumentCalibration/holman1989.pdf
Doebelin, E. O. (1990). Measurement Systems (4th ed.). New York, NY: McGraw-Hill.
Database Acquisition
- Get the database from the repository: http://54.243.252.9/engr-1330-webroot/6-Projects/P-InstrumentCalibration/PressureSensorData.csv
Exploratory Data Analysis
- Describe the database. Include visualization of the database.
- Reformat as needed (column headings perhaps) the database for subsequent analysis.
- For each measurement system (analog readout, sensor voltage): Plot the data (as symbols) e.g. true pressure versus analog pressure; analog pressure versus volts; true pressure versus volts. Describe the plots.
- Select possible data model structures (linear model, power-law, ...)
- Select possible data model "fitting" tools (ordinary least squares,lasso regression, decision trees, random forests, ...)
Model Building
- Build data models
- Assess data model quality (decide which model is best) including visualization tools (red line through blue dots ...)
- Build the input data interface for using the "best" model(s)
- Assume that you are now using your calibrated analog pressure gauge to make a reading in the field. You read a value of 64 psi on the gauge. Estimate the true pressure at 95 percent confidence. Be sure to report your result with a value with an appropriate number of digits, an uncertainty bracket, units, and a confidence level.
- Assume that you are now using your calibrated pressure transducer to make a reading in the field. You read a value of 1.4320 Volts . Estimate the true pressure at 95 percent confidence. Be sure to report your result with a value with an appropriate number of digits, an uncertainty bracket, units, and a confidence level.
- Using your best model determine projected pressure readings and an assessment of uncertainty for 5 sensor voltages in the table below.
| Test | Sensor Voltage |
|---|---|
| U1 | 3.0 |
| U2 | 0.2 |
| U3 | 0.03 |
| U4 | 5.0 |
| U5 | 0.07 |
Deliverables:
Effort Sheets (due every week on Friday):
Each team must submit an effort sheet which is a table with a clear discription of the tasks undertaken by each member and has the signiture of all team members. The effort sheets should be submitted digitally via Blackboard.
Part 1 (due Wednesday April 20th, 2022):
This report must include:
- The "Literature Research" section
- A description of the Instrument Calibration database
- A plan of work for how you want to handle the project and solve the modeling tasks.
- Break down each task into manageable subtasks and describe how you intend to solve the subtasks and how you will test each task. (Perhaps make a simple Gantt Chart)
- Address the responsibilities of each team member for tasks completed and tasks to be completed until the end of the semester. (Perhaps make explicit subtask assignments)
Your report should be limited to 7 pages, 12 pt font size, double linespacing (exclusive of references which are NOT included in the page count). You need to cite/reference all sources you used. This report must be submitted by Midnight April 20th in PDF format.
Part 2 (due Tuesday May 2nd, 2022):
This report must include:
- All the required parts, including the ones from the Interim report as well as the sections on EDA and Model Building parts.
- All the filled effort sheets with the signitures of the team members with a clear description of all the tasks performed by each member.
All the references used in the entire length of the project.
This report must be submitted by Midnight May 2nd in PDF format, along with the following documents:- A well-documented Jupyter Notebook (.ipynb file) for the analysis and implementation of the data models.
A well-documented Jupyter Notebook (.ipynb file) for the implementation of the data model user interface.
Above items can reside in a single notebook; but clearly identify sections that perform different tasks.
A how-to video demonstrating the application, performance and description of what you did for the project, including the problems that you solved as well as those that you were not able to solve.
A project management video (up to 5 minutes) in which you explain how you completed the project and how you worked as a team.
Above items can reside in a single video; but structure the video into the two parts; use an obvious transition when moving from "how to ..." into the project management portion.
Keep the total video length to less than 10 minutes; submit as an "unlisted" YouTube video, and just supply the link (someone on each team is likely to have a YouTube creator account). Keep in mind a 10 minute video can approach 100MB file size before compression, so it won't upload to Blackboard and cannot be emailed.