Download (right-click, save target as ...) this page as a jupyterlab notebook from: Lab18
Laboratory 18: Causality, Simulation, and Probability
LAST NAME, FIRST NAME
R00000000
ENGR 1330 Laboratory 14 - In-Lab
Exercise 0 Profile your computer
Execute the cell below
# Preamble script block to identify host, user, and kernel
import sys
! hostname
! whoami
print(sys.executable)
print(sys.version)
print(sys.version_info)
Python for Simulation
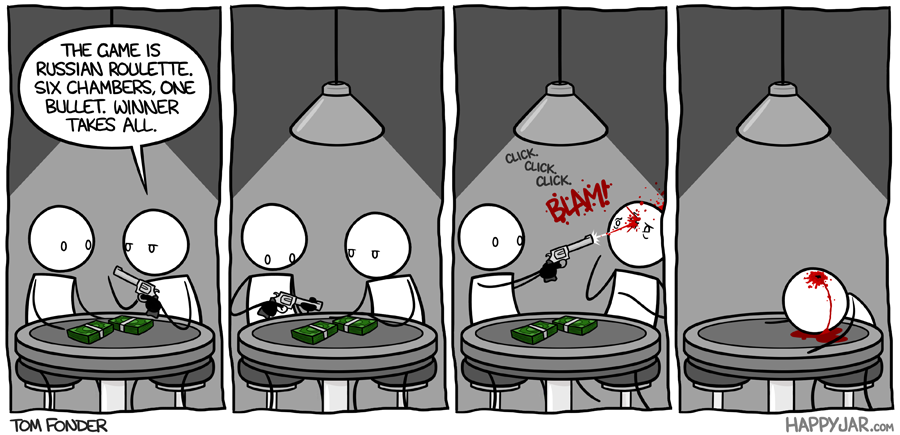
What is Russian roulette?
Russian roulette (Russian: русская рулетка, russkaya ruletka) is a lethal game of chance in which a player places a single round in a revolver, spins the cylinder, places the muzzle against their head, and pulls the trigger in hopes that the loaded chamber does not align with the primer percussion mechanism and the barrel, causing the weapon to discharge. Russian refers to the supposed country of origin, and roulette to the element of risk-taking and the spinning of the revolver's cylinder, which is reminiscent of a spinning roulette wheel.
- Wikipedia @ https://en.wikipedia.org/wiki/Russian_roulette

A game of dafts, a game of chance
One where revolver's the one to dance
Rounds and rounds, it goes and spins
Makes you regret all those sins
\ A game of fools, one of lethality
With a one to six probability
There were two guys and a gun
With six chambers but only one...
\ CLICK, one pushed the gun
CLICK, one missed the fun
CLICK, "that awful sound" ...
BANG!, one had his brains all around!
import numpy as np                     #import numpy
revolver = np.array([1,0,0,0,0,0])     #create a numpy array with 1 bullet and 5 empty chambers
print(np.random.choice(revolver,2))              #randomly select a value from revolver - simulation
print(np.random.choice(revolver,5))
print(np.random.choice(revolver,10))

Example: Simulate the results of throwing a D6 (regular dice) for 10 times.
import numpy as np                     #import numpy
dice = np.array([1,2,3,4,5,6])         #create a numpy array with values of a D6
np.random.choice(dice,10)              #randomly selecting a value from dice for 10 times- simulation
Example: Assume the following rules:
If the dice shows 1 or 2 spots, my net gain is -1 dollar.
If the dice shows 3 or 4 spots, my net gain is 0 dollars.
If the dice shows 5 or 6 spots, my net gain is 1 dollar.
Define a function to simulate a game with the above rules, assuming a D6, and compute the net gain of the player over any given number of rolls.
Compute the net gain for 5, 50, and 500 rolls
def D6game(nrolls):
    import numpy as np                     #import numpy
    dice = np.array([1,2,3,4,5,6])         #create a numpy array with values of a D6
    rolls = np.random.choice(dice,nrolls)  #randomly selecting a value from dice for nrolls times- simulation
    gainlist =[]                           #create an empty list for gains|losses
    for i in np.arange(len(rolls)):        #Apply the rules
        if rolls[i]<=2:
            gainlist.append(-1)
        elif rolls[i]<=4:
            gainlist.append(0)
        elif rolls[i]<=6:
            gainlist.append(+1)
    return (np.sum(gainlist))              #sum up all gains|losses
#   return (gainlist,"The net gain is equal to:",np.sum(gainlist))
D6game(5)
D6game(50)
D6game(500)

Let's Make A Deal Game Show and Monty Hall Problem
The Monty Hall problem is a brain teaser, in the form of a probability puzzle, loosely based on the American television game show Let's Make a Deal and named after its original host, Monty Hall. The problem was originally posed (and solved) in a letter by Steve Selvin to the American Statistician in 1975 (Selvin 1975a), (Selvin 1975b).
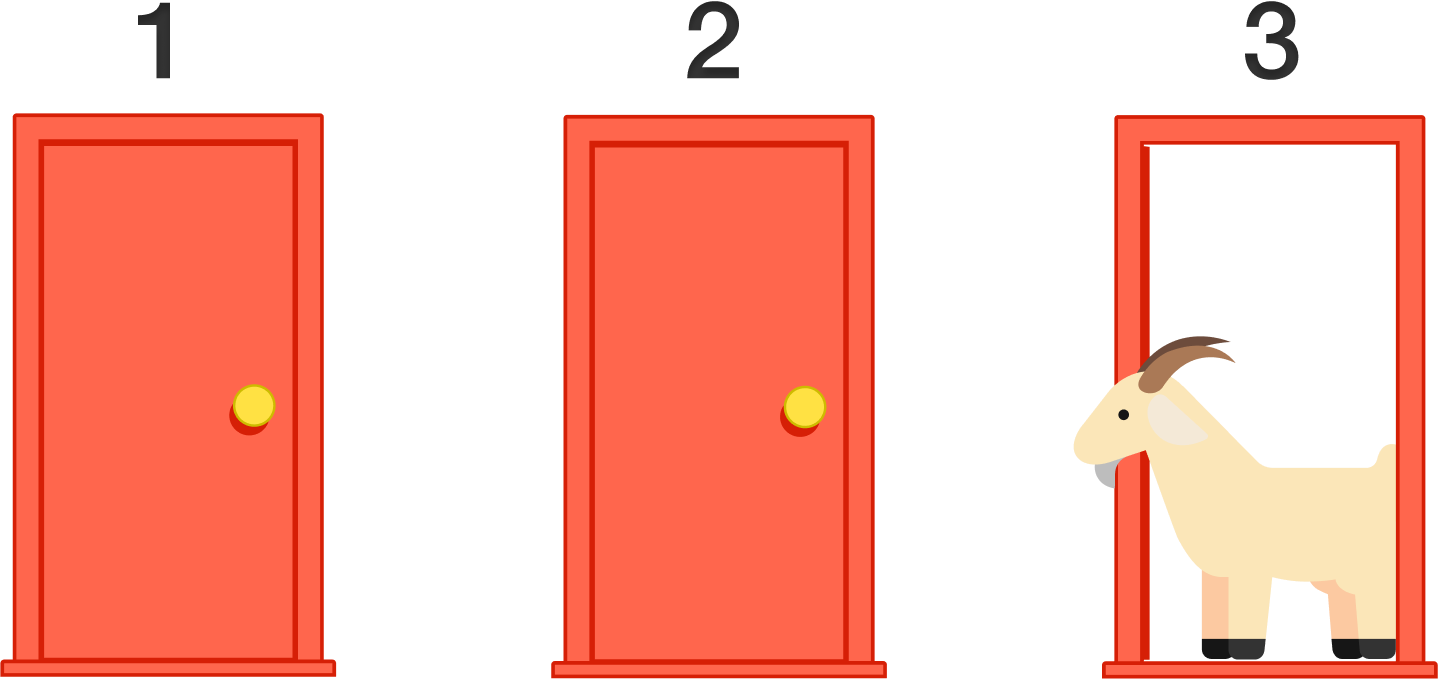
"Suppose you're on a game show, and you're given the choice of three doors: Behind one door is a car; behind the others, goats. You pick a door, say No. 1, and the host, who knows what's behind the doors, opens another door, say No. 3, which has a goat. He then says to you, "Do you want to pick door No. 2?" Is it to your advantage to switch your choice?"
From Wikipedia: https://en.wikipedia.org/wiki/Monty_Hall_problem

/data/img1.png)


Example: Simulate Monty Hall Game for 1000 times. Use a barplot and discuss whether players are better off sticking to their initial choice, or switching doors?
def othergoat(x):         #Define a function to return "the other goat"!
    if x == "Goat 1":
        return "Goat 2"
    elif x == "Goat 2":
        return "Goat 1"
Doors = np.array(["Car","Goat 1","Goat 2"])     #Define a list for objects behind the doors
goats = np.array(["Goat 1" , "Goat 2"])          #Define a list for goats!

def MHgame():
    #Function to simulate the Monty Hall Game
    #For each guess, return ["the guess","the revealed", "the remaining"]
    userguess=np.random.choice(Doors)         #randomly selects a door as userguess
    if userguess == "Goat 1":
        return [userguess, "Goat 2","Car"]
    if userguess == "Goat 2":
        return [userguess, "Goat 1","Car"]
    if userguess == "Car":
        revealed = np.random.choice(goats)
        return [userguess, revealed,othergoat(revealed)]
# Check and see if the MHgame function is doing what it is supposed to do:
for i in np.arange(1):
    a =MHgame()
    print(a)
    print(a[0])
    print(a[1])
    print(a[2])
c1 = []         #Create an empty list for the userguess
c2 = []         #Create an empty list for the revealed
c3 = []         #Create an empty list for the remaining
for i in np.arange(1000):         #Simulate the game for 1000 rounds - or any other number of rounds you desire
    game = MHgame()
    c1.append(game[0])             #In each round, add the first element to the userguess list
    c2.append(game[1])             #In each round, add the second element to the revealed list
    c3.append(game[2])             #In each round, add the third element to the remaining list
import pandas as pd
#Create a data frame (gamedf) with 3 columns ("Guess","Revealed", "Remaining") and 1000 (or how many number of rounds) rows
gamedf = pd.DataFrame({'Guess':c1,
                       'Revealed':c2,
                       'Remaining':c3})
gamedf
# Get the count of each item in the first and 3rd column
original_car =gamedf[gamedf.Guess == 'Car'].shape[0]
remaining_car =gamedf[gamedf.Remaining == 'Car'].shape[0]

original_g1 =gamedf[gamedf.Guess == 'Goat 1'].shape[0]
remaining_g1 =gamedf[gamedf.Remaining == 'Goat 1'].shape[0]

original_g2 =gamedf[gamedf.Guess == 'Goat 2'].shape[0]
remaining_g2 =gamedf[gamedf.Remaining == 'Goat 2'].shape[0]
# Let's plot a grouped barplot
import matplotlib.pyplot as plt

# set width of bar
barWidth = 0.25

# set height of bar
bars1 = [original_car,original_g1,original_g2]
bars2 = [remaining_car,remaining_g1,remaining_g2]

# Set position of bar on X axis
r1 = np.arange(len(bars1))
r2 = [x + barWidth for x in r1]

# Make the plot
plt.bar(r1, bars1, color='darkorange', width=barWidth, edgecolor='white', label='Original Guess')
plt.bar(r2, bars2, color='midnightblue', width=barWidth, edgecolor='white', label='Remaining Door')

# Add xticks on the middle of the group bars
plt.xlabel('Item', fontweight='bold')
plt.xticks([r + barWidth/2 for r in range(len(bars1))], ['Car', 'Goat 1', 'Goat 2'])

# Create legend & Show graphic
plt.legend()
plt.show()
__According to the plot, it is statitically beneficial for the players to switch doors because the initial chance for being correct is only 1/3__

Python for Probability

Important Terminology:
Experiment: An occurrence with an uncertain outcome that we can observe.
For example, rolling a die.
Outcome: The result of an experiment; one particular state of the world. What Laplace calls a "case."
For example: 4.
Sample Space: The set of all possible outcomes for the experiment.
For example, {1, 2, 3, 4, 5, 6}.
Event: A subset of possible outcomes that together have some property we are interested in.
For example, the event "even die roll" is the set of outcomes {2, 4, 6}.
Probability: As Laplace said, the probability of an event with respect to a sample space is the number of favorable cases (outcomes from the sample space that are in the event) divided by the total number of cases in the sample space. (This assumes that all outcomes in the sample space are equally likely.) Since it is a ratio, probability will always be a number between 0 (representing an impossible event) and 1 (representing a certain event).
For example, the probability of an even die roll is 3/6 = 1/2.
import numpy as np
import pandas as pd
import matplotlib.pyplot as plt
Example: In a game of Russian Roulette, the chance of surviving each round is 5/6 which is almost 83%. Using a for loop, compute probability of surviving
- For 2 rounds
- For 5 rounds
- For 10 rounds
nrounds =[]
probs =[]

for i in range(3):
    nrounds.append(i)
    probs.append((5/6)**i) #probability of surviving- not getting the bullet!

RRDF = pd.DataFrame({"# of Rounds": nrounds, "Probability of Surviving": probs})
RRDF
nrounds =[]
probs =[]

for i in range(6):
    nrounds.append(i)
    probs.append((5/6)**i) #probability of surviving- not getting the bullet!

RRDF = pd.DataFrame({"# of Rounds": nrounds, "Probability of Surviving": probs})
RRDF
nrounds =[]
probs =[]

for i in range(11):
    nrounds.append(i)
    probs.append((5/6)**i) #probability of surviving- not getting the bullet!

RRDF = pd.DataFrame({"# of Rounds": nrounds, "Probability of Surviving": probs})
RRDF
RRDF.plot.scatter(x="# of Rounds", y="Probability of Surviving",color="red")
Example: What will be the probability of constantly throwing an even number with a D20 in
- For 2 rolls
- For 5 rolls
- For 10 rolls
- For 15 rolls
nrolls =[]
probs =[]

for i in range(1,16,1):
    nrolls.append(i)
    probs.append((1/2)**i) #probability of throwing an even number-10/20 or 1/2

DRDF = pd.DataFrame({"# of Rolls": nrolls, "Probability of constantly throwing an even number": probs})
DRDF
DRDF.plot.scatter(x="# of Rolls", y="Probability of constantly throwing an even number",color="crimson")
Example: What will be the probability of throwing at least one 6 with a D6:
- For 2 rolls
- For 5 rolls
- For 10 rolls
- For 50 rolls - Make a scatter plot for this one!
nRolls =[]
probs =[]

for i in range(1,3,1):
    nRolls.append(i)
    probs.append(1-(5/6)**i) #probability of at least one 6: 1-(5/6)

rollsDF = pd.DataFrame({"# of Rolls": nRolls, "Probability of rolling at least one 6": probs})
rollsDF
nRolls =[]
probs =[]

for i in range(1,6,1):
    nRolls.append(i)
    probs.append(1-(5/6)**i) #probability of at least one 6: 1-(5/6)

rollsDF = pd.DataFrame({"# of Rolls": nRolls, "Probability of rolling at least one 6": probs})
rollsDF
nRolls =[]
probs =[]

for i in range(1,11,1):
    nRolls.append(i)
    probs.append(1-(5/6)**i) #probability of at least one 6: 1-(5/6)

rollsDF = pd.DataFrame({"# of Rolls": nRolls, "Probability of rolling at least one 6": probs})
rollsDF
nRolls =[]
probs =[]

for i in range(1,51,1):
    nRolls.append(i)
    probs.append(1-(5/6)**i) #probability of at least one 6: 1-(5/6)

rollsDF = pd.DataFrame({"# of Rolls": nRolls, "Probability of rolling at least one 6": probs})
rollsDF.plot.scatter(x="# of Rolls", y="Probability of rolling at least one 6")
Example: What is the probability of drawing an ace at least once (with replacement):
- in 2 tries
- in 5 tries
- in 10 tries
- in 20 tries - make a scatter plot.
nDraws =[]
probs =[]

for i in range(1,3,1):
    nDraws.append(i)
    probs.append(1-(48/52)**i) #probability of drawing an ace least once : 1-(48/52)

DrawsDF = pd.DataFrame({"# of Draws": nDraws, "Probability of drawing an ace at least once": probs})
DrawsDF
nDraws =[]
probs =[]

for i in range(1,6,1):
    nDraws.append(i)
    probs.append(1-(48/52)**i) #probability of drawing an ace least once : 1-(48/52)

DrawsDF = pd.DataFrame({"# of Draws": nDraws, "Probability of drawing an ace at least once": probs})
DrawsDF
nDraws =[]
probs =[]

for i in range(1,11,1):
    nDraws.append(i)
    probs.append(1-(48/52)**i) #probability of drawing an ace least once : 1-(48/52)

DrawsDF = pd.DataFrame({"# of Draws": nDraws, "Probability of drawing an ace at least once": probs})
DrawsDF
nDraws =[]
probs =[]

for i in range(1,21,1):
    nDraws.append(i)
    probs.append(1-(48/52)**i) #probability of drawing an ace at least once : 1-(48/52)

DrawsDF = pd.DataFrame({"# of Draws": nDraws, "Probability of drawing an ace at least once": probs})
DrawsDF
DrawsDF.plot.scatter(x="# of Draws", y="Probability of drawing an ace at least once")
Example:
- A) Write a function to find the probability of an event in percentage form based on given outcomes and sample space
- B) Use the function and compute the probability of rolling a 4 with a D6
- C) Use the function and compute the probability of drawing a King from a standard deck of cards
- D) Use the function and compute the probability of drawing the King of Hearts from a standard deck of cards
- E) Use the function and compute the probability of drawing an ace after drawing a king
- F) Use the function and compute the probability of drawing an ace after drawing an ace
- G) Use the function and compute the probability of drawing a heart OR a club
- F) Use the function and compute the probability of drawing a Royal Flush
*hint: (in poker) a straight flush including ace, king, queen, jack, and ten all in the same suit, which is the hand of the highest possible value
This problem is designed based on an example by Daniel Poston from DataCamp, accessible @ https://www.datacamp.com/community/tutorials/statistics-python-tutorial-probability-1
# A
# Create function that returns probability percent rounded to one decimal place
def Prob(outcome, sampspace):
    probability = (outcome / sampspace) * 100
    return round(probability, 1)
# B
outcome = 1       #Rolling a 4 is only one of the possible outcomes
space = 6         #Rolling a D6 can have 6 different outcomes
Prob(outcome, space)
# C
outcome = 4       #Drawing a king is four of the possible outcomes
space = 52        #Drawing from a standard deck of cards can have 52 different outcomes
Prob(outcome, space)
# D
outcome = 1       #Drawing the king of hearts is only 1 of the possible outcomes
space = 52        #Drawing from a standard deck of cards can have 52 different outcomes
Prob(outcome, space)
# E
outcome = 4       #Drawing an ace is 4 of the possible outcomes
space = 51        #One card has been drawn
Prob(outcome, space)
# F
outcome = 3       #Once Ace is already drawn
space = 51        #One card has been drawn
Prob(outcome, space)
# G
hearts = 13       #13 cards of hearts in a deck
space = 52        #total number of cards in a deck
clubs = 13        #13 cards of clubs in a deck
Prob_heartsORclubs= Prob(hearts, space) + Prob(clubs, space)
print("Probability of drawing a heart or a club is",Prob_heartsORclubs,"%")
# F
draw1 = 5       #5 cards are needed
space1 = 52        #out of the possible 52 cards
draw2 = 4       #4 cards are needed
space2 = 51        #out of the possible 51 cards
draw3 = 3       #3 cards are needed
space3 = 50        #out of the possible 50 cards
draw4 = 2       #2 cards are needed
space4 = 49        #out of the possible 49 cards
draw5 = 1       #1 cards is needed
space5 = 48        #out of the possible 48 cards

#Probability of a getting a Royal Flush
Prob_RF= 4*(Prob(draw1, space1)/100) * (Prob(draw2, space2)/100) * (Prob(draw3, space3)/100) * (Prob(draw4, space4)/100) * (Prob(draw5, space5)/100)
print("Probability of drawing a royal flush is",Prob_RF,"%")
Example: Two unbiased dice are thrown once and the total score is observed. Define an appropriate function and use a simulation to find the estimated probability that :
- the total score is greater than 10?
- the total score is even and greater than 7?
This problem is designed based on an example by Elliott Saslow from Medium.com, accessible @ https://medium.com/future-vision/simulating-probability-events-in-python-5dd29e34e381
import numpy as np
def DiceRoll1(nSimulation):
    count =0
    dice = np.array([1,2,3,4,5,6])         #create a numpy array with values of a D6
    for i in range(nSimulation):
        die1 = np.random.choice(dice,1)    #randomly selecting a value from dice - throw the D6 once
        die2 = np.random.choice(dice,1)    #randomly selecting a value from dice - throw the D6 once again!
        score = die1 + die2                #summing them up
        if score > 10:                     #if it meets our desired condition:
            count +=1                      #add one to the "count"
    return count/nSimulation               #compute the probability of the desired event by dividing count by the total number of trials

nSimulation = 10000
print("The probability of rolling a number greater than 10 after",nSimulation,"rolld is:",DiceRoll1(nSimulation)*100,"%")
import numpy as np
def DiceRoll2(nSimulation):
    count =0
    dice = np.array([1,2,3,4,5,6])         #create a numpy array with values of a D6
    for i in range(nSimulation):
        die1 = np.random.choice(dice,1)    #randomly selecting a value from dice - throw the D6 once
        die2 = np.random.choice(dice,1)    #randomly selecting a value from dice - throw the D6 once again!
        score = die1 + die2
        if score %2 ==0 and score > 7:      #the total score is even and greater than 7
            count +=1
    return count/nSimulation

nSimulation = 10000
print("The probability of rolling an even number and greater than 7 after",nSimulation," rolls is:",DiceRoll2(nSimulation)*100,"%")
Example: An urn contains 10 white balls, 20 reds and 30 greens. We want to draw 5 balls with replacement. Use a simulation (10000 trials) to find the estimated probability that:
- we draw 3 white and 2 red balls
- we draw 5 balls of the same color
This problem is designed based on an example by Elliott Saslow from Medium.com, accessible @ https://medium.com/future-vision/simulating-probability-events-in-python-5dd29e34e381
# A
import numpy as np
import random
d = {}                     #Create an empty dictionary to associate numbers and colors
for i in range(0,60,1):     #total of 60 balls
    if i <10:                 #10 white balls
        d[i]="White"
    elif i>9 and i<30:         #20 red balls
        d[i]="Red"
    else:                         #60-30=30 green balls
        d[i]="Green"
#
nSimulation= 10000         #How many trials?
outcome1= 0                #initial value on the desired outcome counter

for i in range(nSimulation):
    draw=[]                     #an empty list for the draws
    for i in range(5):                               #how many balls we want to draw?
        draw.append(d[random.randint(0,59)])         #randomly choose a number from 0 to 59- simulation of drawing balls
    drawarray = np.array(draw)                       #convert the list into a numpy array
    white = sum(drawarray== "White")                 #count the white balls
    red = sum(drawarray== "Red")                     #count the red balls
    green = sum(drawarray== "Green")                 #count the green balls
    if white ==3 and red==2:                         #If the desired condition is met, add one to the counter
        outcome1 +=1
print("The probability of drawing 3 white and 2 red balls is",(outcome1/nSimulation)*100,"%")
# B
import numpy as np
import random
d = {}
for i in range(0,60,1):
    if i <10:
        d[i]="White"
    elif i>9 and i<30:
        d[i]="Red"
    else:
        d[i]="Green"
#
nSimulation= 10000
outcome1= 0
outcome2= 0         #we can consider multiple desired outcomes


for i in range(nSimulation):
    draw=[]
    for i in range(5):
        draw.append(d[random.randint(0,59)])
    drawarray = np.array(draw)
    white = sum(drawarray== "White")
    red = sum(drawarray== "Red")
    green = sum(drawarray== "Green")
    if white ==3 and red==2:
        outcome1 +=1
    if white ==5 or red==5 or green==5:
        outcome2 +=1

print("The probability of drawing 3 white and 2 red balls is",(outcome1/nSimulation)*100,"%")
print("The probability of drawing 5 balls of the same color is",(outcome2/nSimulation)*100,"%")

Here are some of the resources used for creating this notebook:
- "Poker Probability and Statistics with Python" by Daniel Poston available at https://www.datacamp.com/community/tutorials/statistics-python-tutorial-probability-1
- "Simulating probability events in Python" by Elliott Saslow available at https://medium.com/future-vision/simulating-probability-events-in-python-5dd29e34e381
Here are some great reads on this topic:
- "Simulate the Monty Hall Problem Using Python" by randerson112358 available at https://medium.com/swlh/simulate-the-monty-hall-problem-using-python-7b76b943640e
- "The Monty Hall problem" available at https://scipython.com/book/chapter-4-the-core-python-language-ii/examples/the-monty-hall-problem/
- "Introduction to Probability Using Python" by Lisandra Melo available at https://medium.com/future-vision/simulating-probability-events-in-python-5dd29e34e381
- "Introduction to probability and statistics for Data Scientists and machine learning using python : Part-1" by Arun Singh available at https://medium.com/@anayan/introduction-to-probability-and-statistics-for-data-scientists-and-machine-learning-using-python-377a9b082487
Here are some great videos on these topics:
- "Monty Hall Problem - Numberphile" by Numberphile available at https://www.youtube.com/watch?v=4Lb-6rxZxx0
- "The Monty Hall Problem" by D!NG available at https://www.youtube.com/watch?v=TVq2ivVpZgQ
- "21 - Monty Hall - PROPENSITY BASED THEORETICAL MODEL PROBABILITY - MATHEMATICS in the MOVIES" by Motivating Mathematical Education and STEM available at https://www.youtube.com/watch?v=iBdjqtR2iK4
- "The Monty Hall Problem" by niansenx available at https://www.youtube.com/watch?v=mhlc7peGlGg
- "The Monty Hall Problem - Explained" by AsapSCIENCE available at https://www.youtube.com/watch?v=9vRUxbzJZ9Y
- "Introduction to Probability | 365 Data Science Online Course" by 365 Data Science available at https://www.youtube.com/watch?v=soZRfdnkUQg
- "Probability explained | Independent and dependent events | Probability and Statistics | Khan Academy" by Khan Academy available at https://www.youtube.com/watch?v=uzkc-qNVoOk
- "Math Antics - Basic Probability" by mathantics available at https://www.youtube.com/watch?v=KzfWUEJjG18

