Download this page as a jupyter notebook at Lab 10
LAST NAME, FIRST NAME
R00000000
ENGR 1330 Laboratory 10 - In Lab
# Preamble script block to identify host, user, and kernel
import sys
! hostname
! whoami
print(sys.executable)
print(sys.version)
print(sys.version_info)
The Pandas library is a preferred tool for data scientists to perform data manipulation and analysis, next to matplotlib for data visualization and NumPy for scientific computing in Python.
The fast, flexible, and expressive Pandas data structures are designed to make real-world data analysis significantly easier, but this might not be immediately the case for those who are just getting started with it. Exactly because there is so much functionality built into this package that the options are overwhelming.
Hence summary sheets will be useful
A summary sheet: https://pandas.pydata.org/Pandas_Cheat_Sheet.pdf
A different one: http://datacamp-community-prod.s3.amazonaws.com/f04456d7-8e61-482f-9cc9-da6f7f25fc9b
A data table is called a DataFrame
in pandas (and other programming environments too).
The figure below from https://pandas.pydata.org/docs/getting_started/index.html illustrates a dataframe model:
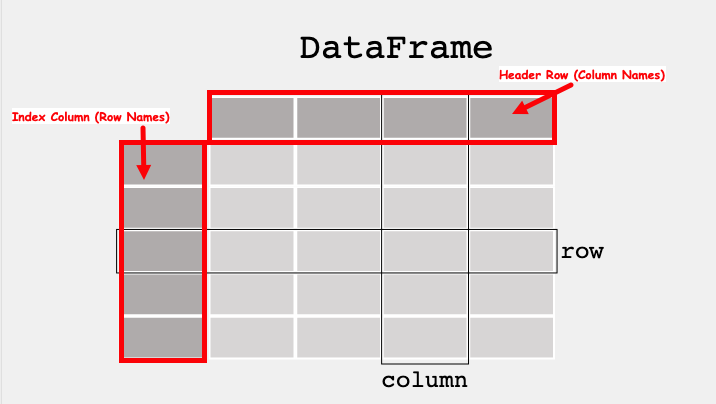
Each column and each row in a dataframe is called a series, the header row, and index column are special.
To use pandas, we need to import the module, often pandas has numpy as a dependency so it also must be imported
import numpy
import pandas
First lets construct a dataframe like object using python primatives. We will construct 3 lists, one for row names, one for column names, and one for the content.
mytabular = numpy.random.randint(1,100,(5,4))
myrowname = ['A','B','C','D','E']
mycolname = ['W','X','Y','Z']
mytable = [['' for jcol in range(len(mycolname)+1)] for irow in range(len(myrowname)+1)] #non-null destination matrix, note the implied loop construction
The above builds a placeholder named mytable
for the psuedo-dataframe.
Next we populate the table, using a for loop to write the column names in the first row, row names in the first column, and the table fill for the rest of the table.
for irow in range(1,len(myrowname)+1): # write the row names
mytable[irow][0]=myrowname[irow-1]
for jcol in range(1,len(mycolname)+1): # write the column names
mytable[0][jcol]=mycolname[jcol-1]
for irow in range(1,len(myrowname)+1): # fill the table (note the nested loop)
for jcol in range(1,len(mycolname)+1):
mytable[irow][jcol]=mytabular[irow-1][jcol-1]
Now lets print the table out by row and we see we have a very dataframe-like structure
for irow in range(0,len(myrowname)+1):
print(mytable[irow][0:len(mycolname)+1])
We can also query by row
print(mytable[3][0:len(mycolname)+1])
Or by column
for irow in range(0,len(myrowname)+1): #cannot use implied loop in a column slice
print(mytable[irow][2])
Or by row+column index; sort of looks like a spreadsheet syntax.
print(' ',mytable[0][3])
print(mytable[3][0],mytable[3][3])
We will now do the same using pandas
df = pandas.DataFrame(numpy.random.randint(1,100,(5,4)), ['A','B','C','D','E'], ['W','X','Y','Z'])
df
We can also turn our table into a dataframe, notice how the constructor adds header row and index column
df1 = pandas.DataFrame(mytable)
df1
To get proper behavior, we can just reuse our original objects
df2 = pandas.DataFrame(mytabular,myrowname,mycolname)
df2
The shape method will return the row and column rank (count) of a dataframe.
df.shape
df1.shape
df2.shape
To append a column simply assign a value to a new column name to the dataframe
df['new']= 'NA'
df
A bit trickier but we can create a copy of a row and concatenate it back into the dataframe.
newrow = df.loc[['E']].rename(index={"E": "X"}) # create a single row, rename the index
newtable = pandas.concat([df,newrow]) # concatenate the row to bottom of df - note the syntax
newtable
To remove a column is straightforward, we use the drop method
newtable.drop('new', axis=1, inplace = True)
newtable
To remove a row, you really got to want to, easiest is probablty to create a new dataframe with the row removed
newtable = newtable.loc[['A','B','D','E','X']] # select all rows except C
newtable
We have already been indexing, but a few examples follow:
newtable['X'] #Selecing a single column
newtable[['X','W']] #Selecing a multiple columns
newtable.loc['E'] #Selecing rows based on label via loc[ ] indexer
newtable.loc[['E','X','B']] #Selecing multiple rows based on label via loc[ ] indexer
newtable.loc[['B','E','D'],['X','Y']] #Selecting elemens via both rows and columns via loc[ ] indexer
df = pandas.DataFrame({'col1':[1,2,3,4,5,6,7,8],
'col2':[444,555,666,444,666,111,222,222],
'col3':['orange','apple','grape','mango','jackfruit','watermelon','banana','peach']})
df
#What fruit corresponds to the number 555 in ‘col2’?
df[df['col2']==555]['col3']
#What fruit corresponds to the minimum number in ‘col2’?
df[df['col2']==df['col2'].min()]['col3']
#Creating a dataframe from a dictionary
df = pandas.DataFrame({'col1':[1,2,3,4,5,6,7,8],
'col2':[444,555,666,444,666,111,222,222],
'col3':['orange','apple','grape','mango','jackfruit','watermelon','banana','peach']})
df
head
method¶Returns the first few rows, useful to infer structure
#Returns only the first five rows
df.head()
info
method¶Returns the data model (data column count, names, data types)
#Info about the dataframe
df.info()
describe
method¶Returns summary statistics of each numeric column.
Also returns the minimum and maximum value in each column, and the IQR (Interquartile Range).
Again useful to understand structure of the columns.
#Statistics of the dataframe
df.describe()
There are also methods for counts and sums by specific columns
df['col2'].sum() #Sum of a specified column
The unique
method returns a list of unique values (filters out duplicates in the list, underlying dataframe is preserved)
df['col2'].unique() #Returns the list of unique values along the indexed column
The nunique
method returns a count of unique values
df['col2'].nunique() #Returns the total number of unique values along the indexed column
The value_counts()
method returns the count of each unique value (kind of like a histogram, but each value is the bin)
df['col2'].value_counts() #Returns the number of occurences of each unique value
The power of pandas is an ability to apply a function to each element of a dataframe series (or a whole frame) by a technique called symbolic (or synthetic programming) application of the function.
Its pretty complicated but quite handy, best shown by an example
def times2(x): # A prototype function to scalar multiply an object x by 2
return(x*2)
print(df)
print('Apply the times2 function to col2')
df['col2'].apply(times2) #Symbolic apply the function to each element of column col2, result is another dataframe
df.sort_values('col2', ascending = True) #Sorting based on columns
Create a prototype function to compute the cube root of a numeric object (literally two lines to define the function), recall exponentation is available in primative python.
Apply your function to column 'X' of dataframe newtable
created above
# Define your function here:
# Symbolic apply here:
#Creating a dataframe from a dictionary
data = {
'key' : ['A', 'B', 'C', 'A', 'B', 'C'],
'data1' : [1, 2, 3, 4, 5, 6],
'data2' : [10, 11, 12, 13, 14, 15],
'data3' : [20, 21, 22, 13, 24, 25]
}
df1 = pandas.DataFrame(data)
df1
# Grouping and summing values in all the columns based on the column 'key'
df1.groupby('key').sum()
# Grouping and summing values in the selected columns based on the column 'key'
df1.groupby('key')[['data1', 'data2']].sum()
#Creating a dataframe from a dictionary
df = pandas.DataFrame({'col1':[1,2,3,4,None,6,7,None],
'col2':[444,555,None,444,666,111,None,222],
'col3':['orange','apple','grape','mango','jackfruit','watermelon','banana','peach']})
df
Below we drop any row that contains a NaN
code.
df_dropped = df.dropna()
df_dropped
Below we replace NaN
codes with some value, in this case 0
df_filled1 = df.fillna(0)
df_filled1
Below we replace NaN
codes with some value, in this case the mean value of of the column in which the missing value code resides.
df_filled2 = df.fillna(df.mean())
df_filled2
Replace the 'NaN' codes with the string 'missing' in dataframe 'df'
# Replace the NaN with the string 'missing' here: