USGS MOC Project 1
A 300-ft thick aquifer is used for water supply. The aquifer is also under consideration as a disposal field for treated waste water (aquifer-storage-recovery), where the filtration and dilution capacity of the aquifer will be used to receive the waste water for intentional re-use.
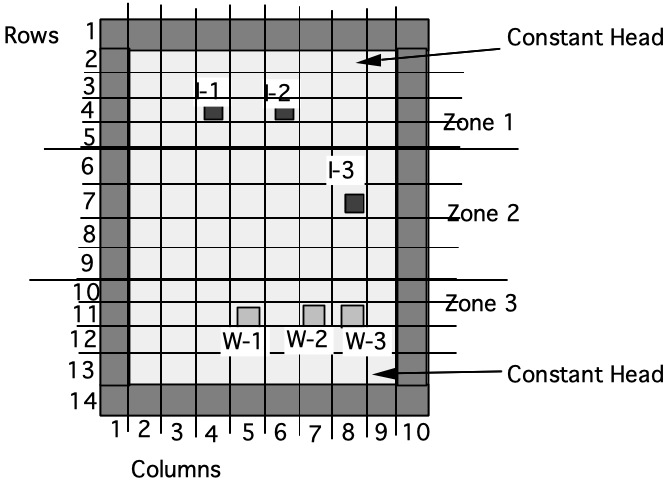
The figure below is a plan-view representation of a conceptual model of the aquifer. Each cell in the schematic is $1,500$ feet by $1,500$ feet.

The northern constant head boundary is set at h=600 ft. The southern edge constant boundary varies from 540 ft to 520 ft as one traverses from east to west. Three water supply wells, W-1, W-2, and W-3 are already in service. Hydrologic data suggests that the aquifer system has three distinct zones with different hydraulic characteristics. These characteristics are tabulated below.
| Zone | K(cm/sec) | $n$ |
|---|---|---|
| 1 | 4.72 | 0.20 |
| 2 | 1.57 | 0.20 |
| 3 | 0.47 | 0.20 |
The longitudinal dispersivity has been estimated as $\alpha_l=50~m$ and the transverse dispersivity has been estimated at $\alpha_t=20~m$. The drinking water wells supply water at the rates tabulated below.
| Well | Q(cfs) |
|---|---|
| W-1 | 16.0 |
| W-2 | 7.0 |
| W-3 | 7.0 |
The proposed re-use scheme will inject tracer-labeled waste-water into the aquifer into any of the three injection sites, I-1, I-2, or I-3. The goal is for the concentration of the non-toxic tracer to never exceede 250 mg/L at the water production wells. The tracer is added just before injection as a dilution indicator so that the water utility can shut down a well if the water in that well is not sufficiently diluted (much like the tracer added to natural gas to detect leaks). The tracer concentration at the injection point is 1000 mg/L (the operation goal is the dilute the waste water four fold before it reaches the drinking water wells).
Determine using MOC the answers to the questions below.
- Can 30 cfs of waste water be injected at I-3 and meet the water quality goal (4:1 dilution at drinking water wells)?
- Is it possible to inject more waste water (higher flow or different location)?
- Find the maximum volume that can be injected (at any or all of the three sites) and meet the water quality goal - this is the "regulatory assimilative capacity of the system." Does this volume exceed the drinking water demand currently satisfied by the three wells?
- Assume that instead of a non-toxic tracer, the injection water concentration represents some particular water quality parameter. Assuming that the injection rate never exceedes the demand rate, what is the maximum waste load (mg/sec) that can be put into the aquifer and meet the raw water quality goal?
Submit your response as a short report using the suggested format below:
- Front matter:
Title Page: Title of the Report Author(s) Date Affiliation/Institution
Table of Contents: List of Sections and Subsections with Page Numbers
List of Figures and Tables: Numbered List of Figures and Tables with Captions and Page Numbers
Executive Summary: A concise summary of the main objectives, methodology, key findings, and recommendations. This section should provide a quick overview of the report's main points.
Introduction: Background and context of the groundwater modeling study Objectives and goals of the modeling project. Scope and limitations of the study.
Literature Review: Review of relevant literature and prior research on the study area, hydrogeology, and similar modeling studies. Explanation of key concepts and theories related to groundwater modeling.
Study Area and Data Collection: Description of the study area, including its geographical location and hydrogeological characteristics. Details on data collection methods, sources, and types of data used (e.g., well data, geophysical data, hydrological data).
Conceptual Model: Development of the conceptual model, including hydrogeological setting, boundary conditions, and initial conditions. Explanation of the conceptual model's assumptions and simplifications.
Numerical Modeling Approach: Explanation of the numerical modeling software and methodology used. Description of the mathematical equations governing groundwater flow, solute transport, or any relevant processes.
Model Calibration (not enough detail is provided in problem statement, so feel free to skip entirely): Details on the calibration process, including parameter estimation and model adjustments to match observed data. Presentation of calibration results and goodness-of-fit statistics.
Model Validation (not enough detail is provided in problem statement, so feel free to skip entirely): Presentation of validation results to demonstrate the model's accuracy and reliability. Discussion of how well the model reproduces observed groundwater behavior.
Scenario Analysis: Presentation of model simulations for different scenarios, including various input conditions and potential changes in the study area. Discussion of the implications of different scenarios on groundwater behavior.
Results and Discussion: Detailed presentation of modeling results, including maps, graphs, and tables. Interpretation of the results in the context of the study's objectives. Discussion of any trends, anomalies, or significant findings.
Conclusions: Summary of the key findings and their implications. Discussion of the study's contributions to the field and its relevance to decision-making.
Recommendations: Specific recommendations for groundwater management, remediation, or further research based on the modeling results.
References: List of all sources and literature cited in the report, following a standard citation style.
Appendices: Supplementary material such as data tables, model input files, detailed modeling parameters, and additional figures.
Remember to use clear and concise language throughout the report, and include appropriate figures, tables, and citations to support your findings and analysis. Additionally, make sure the report is well-organized and follows a logical flow of information from introduction to conclusions.