Problem 1 (Problem 2-3, pg. 578)
A sand column has the following characteristics:
$$ K = 10^{-4} \frac{cm}{s} \\ A = 75 cm^{2} \\ \frac{dh}{dl} = 0.01 \\ n = 0.20$$Determine:
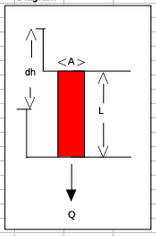
- Sketch the system.
- The discharge velocity.
- The seepage velocity.
- The volumetric flow rate through the column.
sketch

list known quantities
$$ K = 10^{-4} \frac{cm}{s} $$$$ A = 75 cm^{2} $$$$ \frac{dh}{dl} = 0.01 $$ $$ n = 0.20 $$
list unknown quantities
- The discharge velocity, $q = \frac{Q}{A}$
- The seepage velocity, $u = \frac{q}{n} = \frac{Q}{nA}$
- The volumetric flow rate through the column, $Q$
governing principles
- Darcy's law; $Q=KA\frac{dh}{dl}$
- Definition(s) of discharge and seepage velocity
solution details (e.g. step-by-step computations)
K = 1.0e-04
A = 75
dhdl= 0.01
n = 0.20
q=K*dhdl
print("discharge velocity = ",round(q,6)," cm/sec")
u=q/n
print("seepage velocity = ",round(u,6)," cm/sec")
Q=q*A
print("Volumetric discharge = ",round(Q,6)," ml/sec")
discussion
Direct application of Darcy's law and definitions from the mighty internet is all that is required for this exercise.
Problem 2 (Problem 2-12, pg. 579)
Three geologic formations overlie one another with the characteristics listed below.
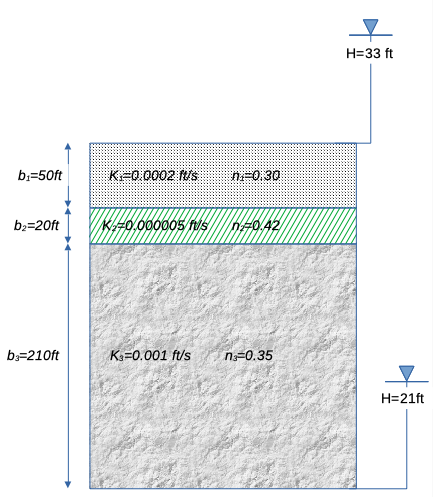
$$ b_1 = 50~ft ~~~~ K_1 = 0.0002 \frac{ft}{s}\\ b_2 = 20~ft ~~~~ K_1 = 0.000005 \frac{ft}{s}\\ b_3 = 210~ft ~~~~ K_1 = 0.001 \frac{ft}{s}$$A constant velocity vertical flow field exists across the three formations. The hydraulic head at the top of the formations (top of formation 1) is 33 feet. The hydraulic head at the bottom of the formations (bottom of formation 3) is 21 feet.
Determine:
- Sketch the system.
- The hydraulic head at the internal boundary between formation 1 and 2.
- The hydraulic head at the internal boundary between formation 2 and 3.
- Approximate time for a tracer to flow through the three layers if the porosities $n_1$, $n_2$, and $n_3$ are 0.30,0.42, and 0.35, respectively
# sketch(s)
# list known quantities
# list unknown quantities
# governing principles
# solution details (e.g. step-by-step computations)
# discussion
sketch

list known quantities
Thickness, hydraulic conductivities, porosities and heads as shown on sketch above.
list unknown quantities
- H at 1-2 interface.
- H at 2-3 interface.
- Time for tracer to traverse entire formation
governing principles
- Darcy's law by layer
- velocity = q/n
- time = thickness/velocity
# Find total discharge per unit area through entire formation
htop=33
hbot=21
k1=0.0002
k2=0.000005
k3=0.001
l1=50
l2=20
l3=210
n1=0.30
n2=0.42
n3=0.35
Kbar=(l1+l2+l3)/((l1/k1) + (l2/k2) + (l3/k3))
print("vertical composite Kv: ",round(Kbar,6)," ft/sec")
dH=htop - hbot
dl = l1+l2+l3
qt=Kbar*dH/dl
print("vertical hydraulic gradient :",round(dH/dl,6)," ft/ft")
print("vertical specific discharge q: ",round(qt,6)," ft/sec")
# find head loss in layer 1
dh1 = l1*qt/k1
h12 = htop -dh1
print("head at layer 1-2 interface :",round(h12,2)," ft ")
# find head loss in layer 2
dh2 = l2*qt/k2
h23 = htop - dh1 -dh2
print("head at layer 2-3 interface :",round(h23,2)," ft ")
# time in layer 1
time1 = l1*n1/qt
print("tracer time in layer 1 :",round(time1,6)," sec")
# time in layer 2
time2 = l2*n2/qt
print("tracer time in layer 2 :",round(time2,6)," sec")
# time in layer 3
time3 = l3*n3/qt
print("tracer time in layer 3 :",round(time3,6)," sec")
totaltime=time1+time2+time3
totaltime=totaltime/86400
print("Tracer travel time :",round(totaltime,3)," days ")
Problem 3 (Problem 2-8, pg. 578)
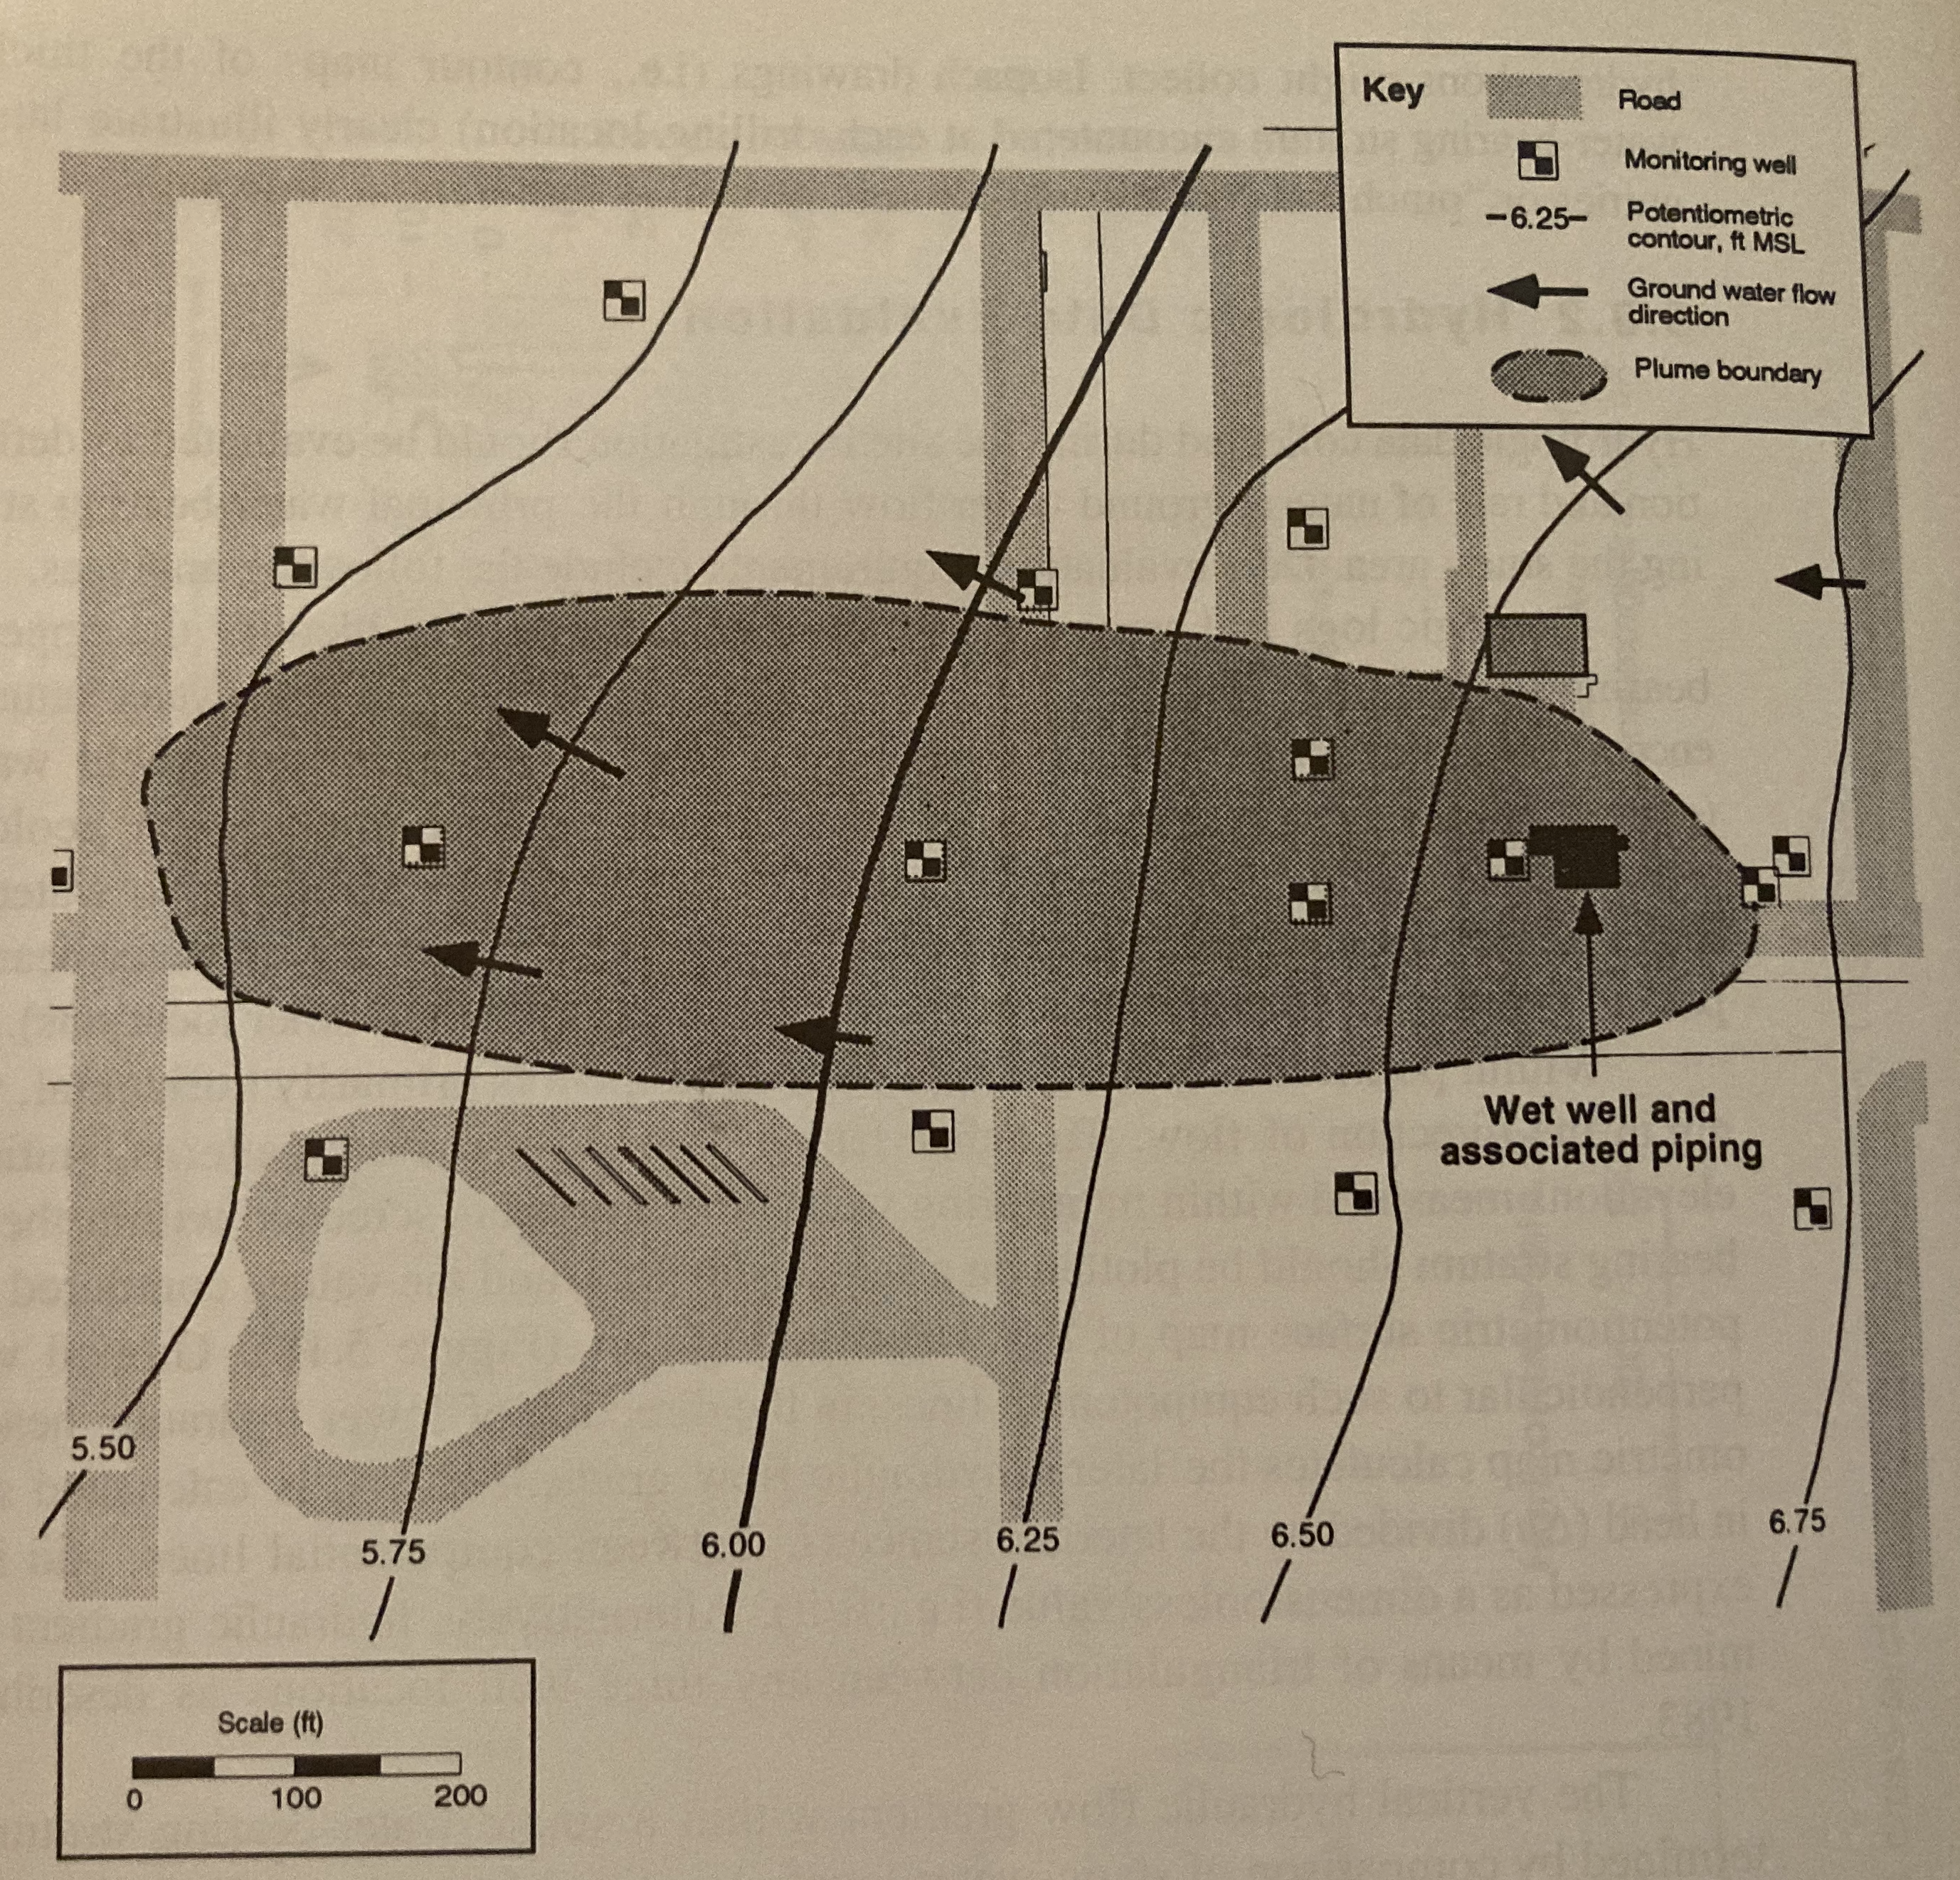
The figure below shows a piezometric map for a shallow sand aquifer. The hydraulic conductivtiy is estimated to be $1.5 \times 10^{-2}~\frac{cm}{s}$, the saturated thickness is 40 feet, and the effective porosity is 0.3.

Determine:
- Which well is expected to be the most contaminated.
- The groundwater velocity and seepage velocity across the plume.
- The duration that the source has been contaminating the aquifer (neglect dispersion, diffusiom, and adsorption).
- The flow rate across the plume.
- An explaination for contamination upgradient of the source zone.
sketch(s)
list known quantities
- Head map (provided)
- $b~\approx~40~feet$
- $K~\approx~ 1.5 \times 10^{-2}~\frac{cm}{s} \cdot \frac{1~in}{2.54~cm} \cdot \frac{1~ft}{12~in} \cdot \frac{86400~s}{1~day} = 42.52~\frac{ft}{day}$
- $n~\approx~ 0.30 $ # list unknown quantities
- Which well is expected to be the most contaminated.
- The groundwater velocity and seepage velocity across the plume.
- The duration that the source has been contaminating the aquifer (neglect dispersion, diffusiom, and adsorption).
- The flow rate across the plume.
- An explaination for contamination upgradient of the source zone.
governing principles
- Darcy's law; $Q=KA\frac{dh}{dl}$
- Definition(s) of discharge and seepage velocity
solution details (e.g. step-by-step computations)
- Which well is expected to be the most contaminated.
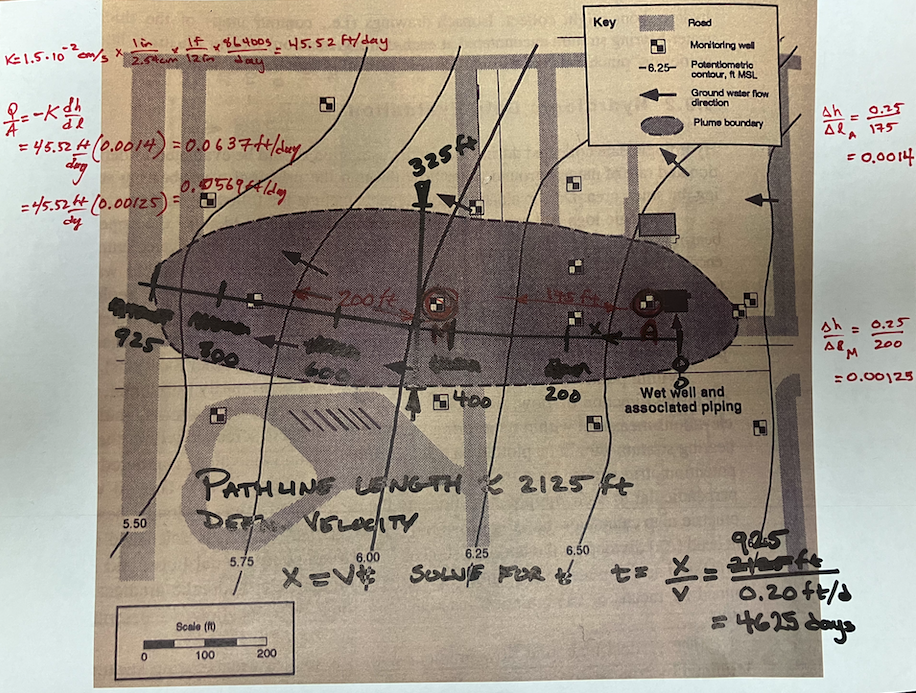
- If release is ongoing, probably well A in annotated map below.
- If release is "past history" then probably well M near middle of the plume.

- The groundwater velocity and seepage velocity across the plume.
- See annotated map below.
- Gradients near well A and well M are calculated directly on the map annotations.
- Specific discharge values:
$q_{near~well~A} = \frac{Q}{A} _{near~well~A}~\approx~45.52\frac{ft}{day}(0.0014)= 0.0637 \frac{ft}{day}$
$q_{near~well~M} = \frac{Q}{A} _{near~well~M}~\approx~45.52\frac{ft}{day}(0.00125)= 0.0569 \frac{ft}{day}$
A reasonable average is $q = \frac{Q}{A} _{average}~\approx~0.06 \frac{ft}{day}$ - Species (seepage) velocity is
$U=\frac{q}{n} = \frac{1}{n} \frac{Q}{A} = \frac{1}{0.3} 0.06 \frac{ft}{day} = 0.2 \frac{ft}{day}$
- The duration that the source has been contaminating the aquifer (neglect dispersion, diffusiom, and adsorption).
- Choose a reasonable pathline like the one on the drawing below and measure its length, then using definition of velocity, solve for duration.
Pathline is $\approx~925~feet$
$t=\frac{x}{U}= \frac{925}{0.02} = 4625~days$
- Choose a reasonable pathline like the one on the drawing below and measure its length, then using definition of velocity, solve for duration.
- The flow rate across the plume.
- Apply Darcy's law
$Q=qA=0.06 \frac{ft}{day} \cdot 325 ft \cdot 40 ft = 780 \frac{ft^3}{day}$
- Apply Darcy's law
- An explaination for contamination upgradient of the source zone.
- Dispersion/diffusion of constituients, and/or
- The regional water table is not static and at some point in past, gradient was in Easterly direction.
discussion
- The non-static water table is very likely, and quarterly monitoring is a usual standard to detect and account for seasonal/temporal variability.
- We will revisit this problem later on when we discuss advection modeling.