Problem 1 (Problem 2-3, pg. 578)
A sand column has the following characteristics:
$$ K = 10^{-4} \frac{cm}{s} \\ A = 75 cm^{2} \\ \frac{dh}{dl} = 0.01 \\ n = 0.20$$Determine:
- Sketch the system.
- The discharge velocity.
- The seepage velocity.
- The volumetric flow rate through the column.
# sketch(s)
# list known quantities
# list unknown quantities
# governing principles
# solution details (e.g. step-by-step computations)
# discussion
Problem 2 (Problem 2-8, pg. 578)
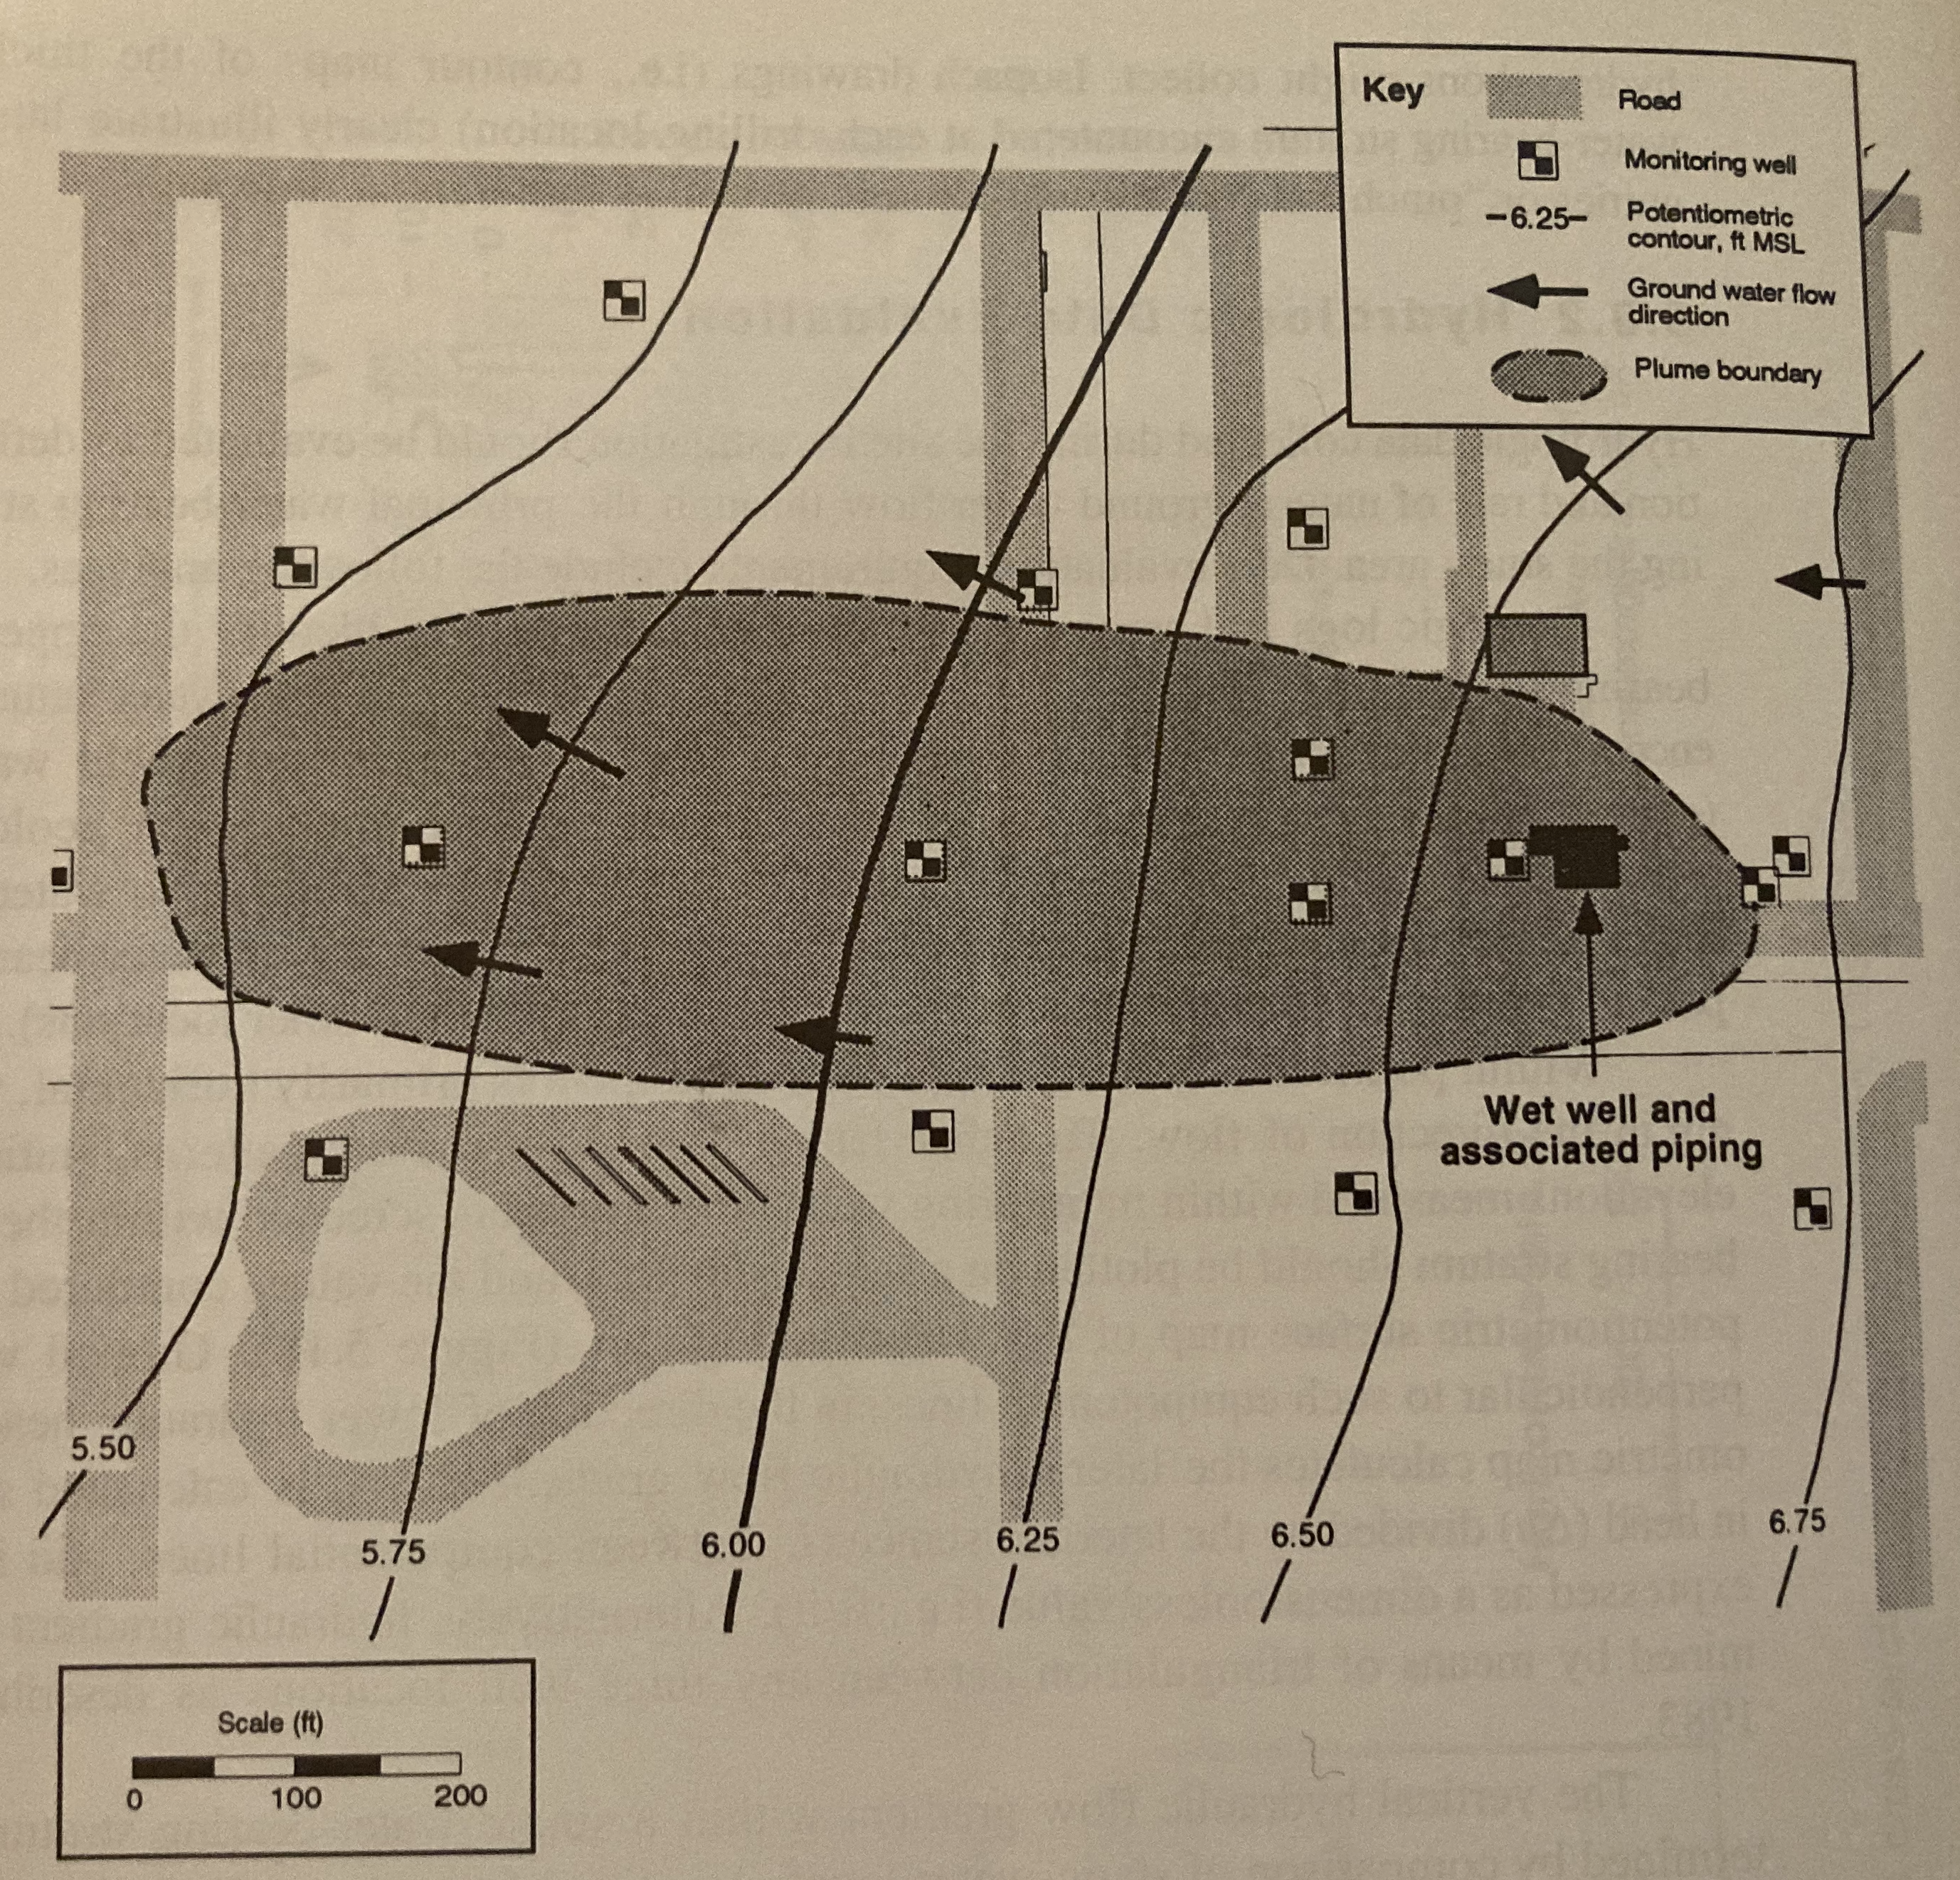
The figure below shows a piezometric map for a shallow sand aquifer. The hydraulic conductivtiy is estimated to be $1.5 \times 10^{-2}~\frac{cm}{s}$, the saturated thickness is 40 feet, and the effective porosity is 0.3.

Determine:
- Which well is expected to be the most contaminated.
- The groundwater velocity and seepage velocity across the plume.
- The duration that the source has been contaminating the aquifer (neglect dispersion, diffusiom, and adsorption).
- The flow rate across the plume.
- An explaination for contamination upgradient of the source zone.
# sketch(s)
# list known quantities
# list unknown quantities
# governing principles
# solution details (e.g. step-by-step computations)
# discussion
Problem 3 (Problem 2-12, pg. 579)
Three geologic formations overlie one another with the characteristics listed below.
$$ b_1 = 50~ft ~~~~ K_1 = 0.0002 \frac{ft}{s}\\ b_2 = 20~ft ~~~~ K_1 = 0.000005 \frac{ft}{s}\\ b_3 = 210~ft ~~~~ K_1 = 0.001 \frac{ft}{s}$$A constant velocity vertical flow field exists across the three formations. The hydraulic head at the top of the formations (top of formation 1) is 33 feet. The hydraulic head at the bottom of the formations (bottom of formation 3) is 21 feet.
Determine:
- Sketch the system.
- The hydraulic head at the internal boundary between formation 1 and 2.
- The hydraulic head at the internal boundary between formation 2 and 3.
- Approximate time for a tracer to flow through the three layers if the porosities $n_1$, $n_2$, and $n_3$ are 0.30,0.42, and 0.35, respectively
# sketch(s)
# list known quantities
# list unknown quantities
# governing principles
# solution details (e.g. step-by-step computations)
# discussion
Problem 4
Three monitoring wells are in a homogeneous isotropic confined aquifer with transmissivity $T=1700\frac{m^2}{day}$. The observed piezometric heads are given in the table below:
| Well ID | Easting Coordinate (m) | Northing Coordinate (m) | Head (m) |
|---|---|---|---|
| MW-1 | 0 | 0 | 120.0 |
| MW-2 | 0 | 300 | 118.4 |
| MW-3 | 200 | 0 | 122.5 |
Determine:
- A contour map of the piezometric surface in the vicinity of these wells using a 1-meter contour interval.
- Magnitude and direction of the gradient of head.
# sketch(s)
# list known quantities
# list unknown quantities
# governing principles
# solution details (e.g. step-by-step computations)
# discussion
Problem 5
Three monitoring wells are in a homogeneous anisotropic aquifer with saturated thickness of 20 m, and hydraulic conductivity given by
$$ \begin{gather} \mathbf{K} = \begin{pmatrix} 30 & ~8 \\ ~\\ 8 & 10 \\ \end{pmatrix} \frac{m}{day} ~ \end{gather} $$The observed piezometric heads are given in the table below:
| Well ID | Easting Coordinate (m) | Northing Coordinate (m) | Head (m) |
|---|---|---|---|
| MW-1 | 0 | 0 | 120.0 |
| MW-2 | 0 | 300 | 118.4 |
| MW-3 | 200 | 0 | 122.5 |
Determine:
- A contour map of the piezometric surface in the vicinity of these wells using a 1-meter contour interval (identical to previous problem).
- Magnitude and direction of the specific discharge through the aquifer.
- Determine the principal values of the hydraulic conductivity $\mathbf{K}$ tensor, and the angle between the principal axes and the Easting-Northing coordinate system.
# sketch(s)
# list known quantities
# list unknown quantities
# governing principles
# solution details (e.g. step-by-step computations)
# discussion