CE 4363/5363 Groundwater Hydrology
Spring 2023 MODFLOW Project
LAST NAME, FIRST NAME
R00000000
Purpose :
Build and operate a MODFLOW management model; interpret results and prepare exhibits for professional presentation
Assessment Criteria :
Completion, results plausible, format correct, example calculations as needed, contour plots with explainations.
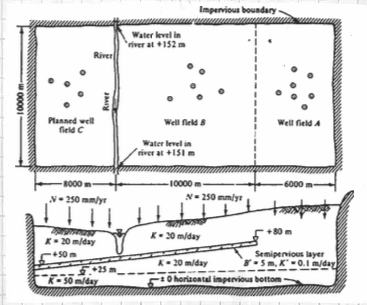
The figure below is a map and cross section of an aquifer system.

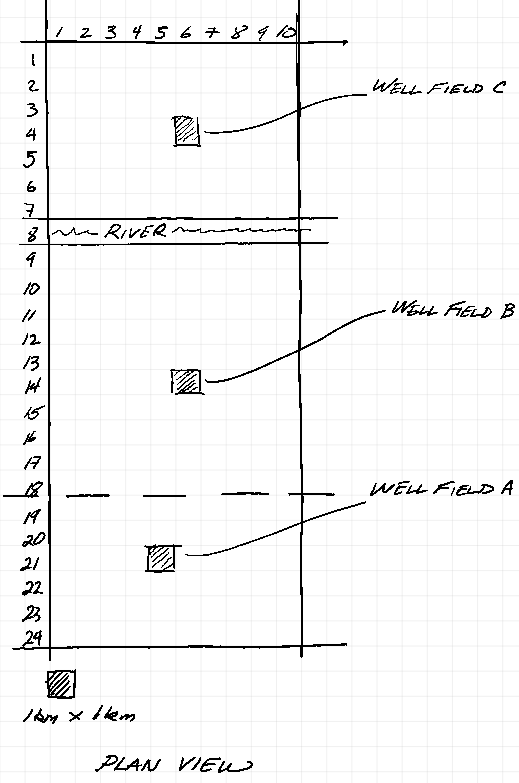
Two well fields operate in the area; well field A pumping $10 \times 10^{6} \frac{m^3}{yr}$ and a well field B pumping $16 \times 10^{6} \frac{m^3}{yr}$ All the intake screens in well field B are below the semipervious layer. A new wellfield, C< is planned, with an annual withdrawl of $15 \times 10^{6} \frac{m^3}{yr}$ and, if possible, up to $25 \times 10^{6} \frac{m^3}{yr}$.
Use MODFLOW to evaluate the feasibility of the proposed pumping rates for well field C. The river itself cannot serve as a water source because the water rights are already apportioned (i.e. someone else owns the water).
Task 1
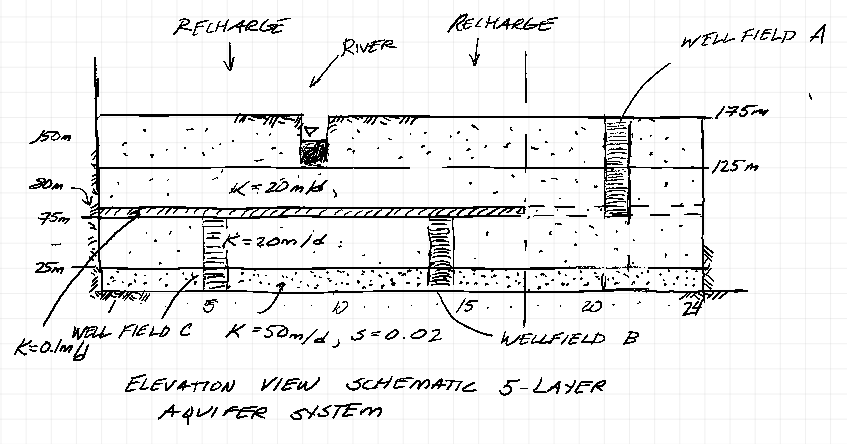
The original management model was lost, but an intermediate development version was preserved at http://54.243.252.9/toolbox/gwhydraulics/modflow/working_files/ce4363-s2023-pr1/, the plan view layout and the 5-layer conceptualization remain are shown. The original management model was created on a 1 X 1 kilometer grid.

The original management model used a 5-layer conceptualization to mimic the aquifer system.

The upper aquifer layer is unconfined and the river was represented using constant head boundaries. The next layer is a confined/unconfined layer and is where the well field A wells are screened (80-125 meters). The aquitard is a thin layer from (75-80 meters) with spatially varying hydraulic conductivity. The lower aquifers are represented as confined in MODFLOW, with well screens as shown. Use MODFLOW to produce a steady-state head distribution for all 5 aquifer layers in this system, with zero pumping in well field C.
The intermediate management model does not have the thin layer permeability correctly supplied in the portion of aquifer around wellfield A.
- Correct the intermediate management model to reflect the proper conductivity/transmissivity in this region.
- Modify the original model to use the river package where the river is a 100-meter wide, 10-meter deep rectangular channel
- Incorporate the recharge package to account for the annual precipitation.
- Using a storativity of 0.02 in the lower aquifer layers and 0.20 in the upper unconfined layer, prepare an equilibrium transient solution and compare it to the steady solution of the corrected model.
- Produce a contour map of heads in the upper layer, and the lower layer. Is there evidence of vertical flow in the predevelopment conditions?
Task 2
Using the model determine the pumping maximum pumping rate from well field C, that does not change the direction of the gradient in the river. That is if the river is gaining from the aquifer it continues to do so.
Task 3
The annual pumpage rate is an average of seasonal rates that follow the schedule in the table below. Modify the model to account for seasonally variable pumping rates as shown in the table below:
| Period | Well Field A ($\frac{m^3}{yr}$) | Well Field B ($\frac{m^3}{yr}$) | Well Field C ($\frac{m^3}{yr}$) |
|---|---|---|---|
| June-August | $13.8 \times 10^{6}$ | $22.08 \times 10^{6}$ | $20.7 \times 10^{6}$ |
| September-November | $9.68 \times 10^{6}$ | $15.44 \times 10^{6}$ | $14.52 \times 10^{6}$ |
| December-February | $6.20 \times 10^{6}$ | $9.92 \times 10^{6}$ | $9.30 \times 10^{6}$ |
| March-May | $10.328 \times 10^{6}$ | $16.51 \times 10^{6}$ | $15.49 \times 10^{6}$ |
Determine how much pumpage in wellfield C can be increased and still preserve the surface water rights. Run the simulation for a ten-year planning horizon.
Task 4 Project Report
- Problem Statement (in your own words, including summarized given information).
- Modeling Efforts.
- Task 1. You must show that you put the proper input values in the right places, and you can use screen captures, tables, and text to do so.
- Task 2. Describe the steps you took in your study. The results should be summarized in tabular form with some verbal discussion, supported with appropriate output graphs.
- Task 3. Describe the steps you took in your study. The results should be summarized in tabular form with some verbal discussion, supported with appropriate output graphs.
- Conclusions. Include any appropriate disclaimers that may limit your recommendation.
- Appendix with sample hand calculations or spreadsheets for RIVER input determination, and variable pumping inputs.
Grading Summary
Problem Statement
- Paraphrased but complete description of provided inputs (10) Task 1 Steady State
- Setup and Inputs as supplied for GWV/MODFLOW Model Grids and Layers (5)
- Aquifer Properties (5)
- River and Well Inputs (10)
- Outputs (5)
- Contour Maps for Layers (5) Task 2 Transient Simulations
- Physical Descriptions (15)
- Proof Drawdown Criteria Were Met (5)
- Contour Maps for Layers (15)
- Comparison of Results (10)
- Conclusions and Limitations (15)