Exercise 4-1 (Problem ?? pp. ??)
The Theis (Eqn. 5.12, p. 162) and Cooper-Jacob (Eqn. 5.54 p. 180) equations can both be used to estimate drawdown for confined aquifer transient problems. A fully penetrating pumping well flows at 300 gpm in a confined aquifer with transmissivity of 11,500 gpd/ft and storage coefficient of 0.00043.
The two models are:
- Theis: $s(r,t) = \frac{Q_w}{4 \pi T}W(u)$
- Cooper-Jacob: $s(r,t) = \frac{Q_w}{4 \pi T}[-0.5772-ln(u)]$
where $u=\frac{r^2 S}{4 T t}$
Determine:
- The drawdown at an observation well 125 ft from the pumping well at 3 hr after pumping started using the Theis solution.
- The drawdown at an observation well 125 ft from the pumping well at 3 hr after pumping started using the Cooper-Jacob simplification.
- For this distance of 125 ft, at what time value in hours does u=0.01?
Exercise 4-2 (Problem ?? pp. ??)
Show how variations in $T$ and $S$ affect transient drawdown curves in an ideal confined aquifer at r = 1, 5, 10, 15, 30, 60, 90, and 120 m when Q = 10 $\frac{L}{sec}$ and t = 400 min.
Determine:
- For $S=5 \times 10^{-4}$ , plot drawdown vs. r for $T=1.0 \times 10^{-1}$ , $1.0 \times 10^{-2}$ , and $1.0 \times 10^{-3}$ $\frac{m^2}{sec}$ on one graph.
- For $T=1.0 \times 10^{-2}$ $\frac{m^2}{sec}$, plot drawdown vs. r for $S=5 \times 10^{-3}$ , $5 \times 10^{-4}$ , and $5 \times 10^{-5}$ on one graph.
- Summarize your findings into a narrative form (e.g. use words)
Exercise 4-3 (Problem ?? pp. ??)
A single ideal pumping well, with radius of 1.0 ft and flow rate of 155 gpm, exists in an ideal confined aquifer. The aquifer has a saturated thickness of 82 ft. The pump continues running until equilibrium conditions are reached. The drawdown at the pumping well is 42 ft, and the drawdown at an observation well 138 ft away is 7.5 ft.
Determine:
- Find the transmissivity in $\frac{ft^2}{d}$ and hydraulic conductivity in $\frac{ft^2}{d}$.
- Find the radius of influence in feet.
Useful References for Problems below:
- Fetter and Kreamer (2022) Applied Hydrology 5ed. pp. 212-215
- Kelvin's Method of Images for potential flow (MIT fluid flow lecture)
- Method of Images (Wikipedia)
- Carslaw and Jaeger (1959), Conduction of Heat in Solids, 2ed. Oxford University Press in particular Chapter 10 pp. 274
Exercise 4-4 (Problem ?? pp. ??)
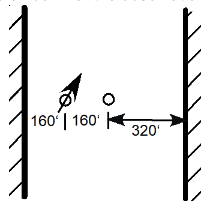
An unconfined aquifer exists where a buried river channel cut into underlying impermeable bedrock. The figure below shows the orientation and pertinent dimensions. The flow rate at the pumping well is 250 gpm, and its radius of influence is 1000 ft. The hydraulic conductivity of the aquifer is 15 ft/d, and the initial saturated thickness is 120 ft. Find the drawdown at the observation well under equilibrium conditions.

Exercise 4-5 (Problem ?? pp. 216)
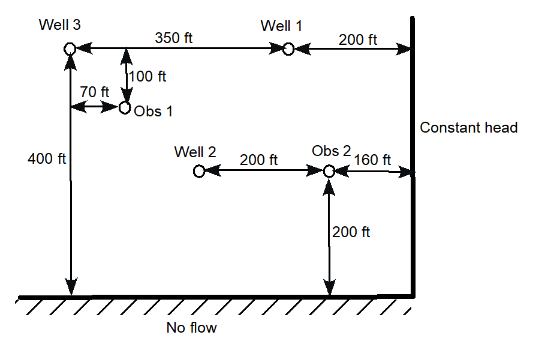
Consider the figure below. Wells 1, 2, and 3 are pumping wells, and Obs 1 and 2 are just observation wells (no pumping at all). Provide a sketch to scale, drawn with a straightedge, that shows all the proper image wells (pp. 212-215) necessary to represent the impacts of the two boundaries on the pumping and observation well drawdowns.

Exercise 4-6 (CE 5363 students)(Problem ?? pp. ??)
A single pumping well, with a flow rate of 250 gpm, fully penetrates a confined aquifer. The aquifer has a saturated thickness of 110 ft, hydraulic conductivity of 20 ft/d, and storage coefficient of 0.00050. Due to outcropping of the aquifer, a no-flow zone exists 200 ft east of the pumping well and extends as a straight line to both north and south. An observation well is located 100 ft south and 120 ft east of the pumping well.
Determine:
- Drawdown in feet at the observation well at time t=1, 5, 10, 20, 30, 40, 60, 80, 100, 120, 240, 480, 600, 720, 840, 960, 1200, and 1440 min after the well is turned on.
- Plot the drawdown vs. log time.
- Change the boundary type to a constant head boundary and plot the drawdown vs. log time.
- Combine the two plots into a single graph (both boundary types - same graphic)
- Summarize your findings in a narrative (e.g. use words).