Download (right-click, save target as ...) this page as a Jupyterlab notebook from: ES-6
CE 4353 Design of Hydraulic Systems
CE 5360 Open Channel Flow
Fall 2023 Exercise Set 6
LAST NAME, FIRST NAME
R00000000
Purpose :
Apply principles of uniform flow to open channel analysis and design
Assessment Criteria :
Completion, results plausible, format correct, calculations (Jupyter Notebook) are shown.
Instructions :
- CE 4353 Complete Problems 1-5
- CE 5360 Complete All Problems
Problem 1
A 5 meter wide rectangular channel with profile grade (bottom slope) $S_0=0.001$ and Manning's $n= 0.013$.
Determine:
- The normal depth in the channel for a prescribed discharge, $Q$
# sketch(s)
# list known quantities
# list unknown quantities
# governing principles
# solution details (e.g. step-by-step computations)
# discussion
Problem 2
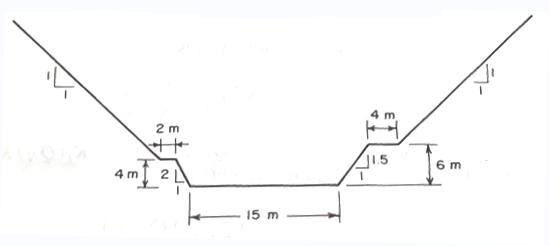
An engineered channel with cross section shown in Figure XX has a discharge of 150 cubic meters per second. The slope of the channel bottom is $S_0=0.002$ and Manning's $n=0.03$.

Determine:
- The normal depth in the channel
- The Froude number in the channel at the normal depth.
# sketch(s)
# list known quantities
# list unknown quantities
# governing principles
# solution details (e.g. step-by-step computations)
# discussion
Problem 3
Construct a script (Jupyter Notebook) to generate the $\frac{Q}{Q_{full}}$, $\frac{V}{V_{full}}$ vs. $\frac{y}{d}$ curves known as the hydraulic elements graph for partially full flow in circular pipes. Inputs to the script will include pipe diameter, $n$, and pipe slope. Use at least 25 pairs of points to define the curves.
# sketch(s)
# list known quantities
# list unknown quantities
# governing principles
# solution details (e.g. step-by-step computations)
# discussion
Problem 4
A 36-inch diameter concrete culvert ($n=0.015$) is laid on a slope of $0.002~\frac{ft}{ft}$. The design discharge is 17 cfs.
Determine:
- Normal depth for the culvert
- Critical depth for the culvert
- Whether the slope is hydraulically mild or steep
# sketch(s)
# list known quantities
# list unknown quantities
# governing principles
# solution details (e.g. step-by-step computations)
# discussion
Problem 5
Design (size) a concrete sewer that has a maximum design discharge of 1.2 $\frac{m^3}{sec}$ and a minimum discharge of 0.3 $\frac{m^3}{sec}$ to be laid on a bed slope of 0.0018
Determine:
- Diameter for the sewer
- Maximum velocity
- Minimum velocity
- If the sewer is self-cleansing
# sketch(s)
# list known quantities
# list unknown quantities
# governing principles
# solution details (e.g. step-by-step computations)
# discussion
Problem 6 (CE 5360)
Figure 6.1 is a photograph of the Pont du Gard; an ancient Roman aqueduct bridge built in the first century AD to carry water over 50 km (31 mi) to the Roman colony of Nemausus (Nîmes). It crosses the river Gardon near the town of Vers-Pont-du-Gard in southern France. The Pont du Gard is the highest of all Roman aqueduct bridges, as well as one of the best preserved.

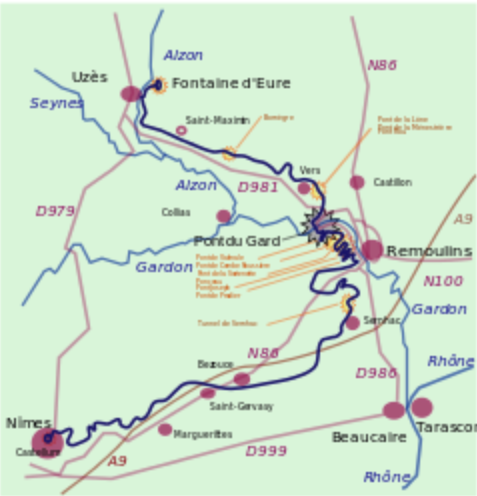
Figure 6.2 is a schematic map of the Roman Aqueduct layout (plan view, not-to-scale).

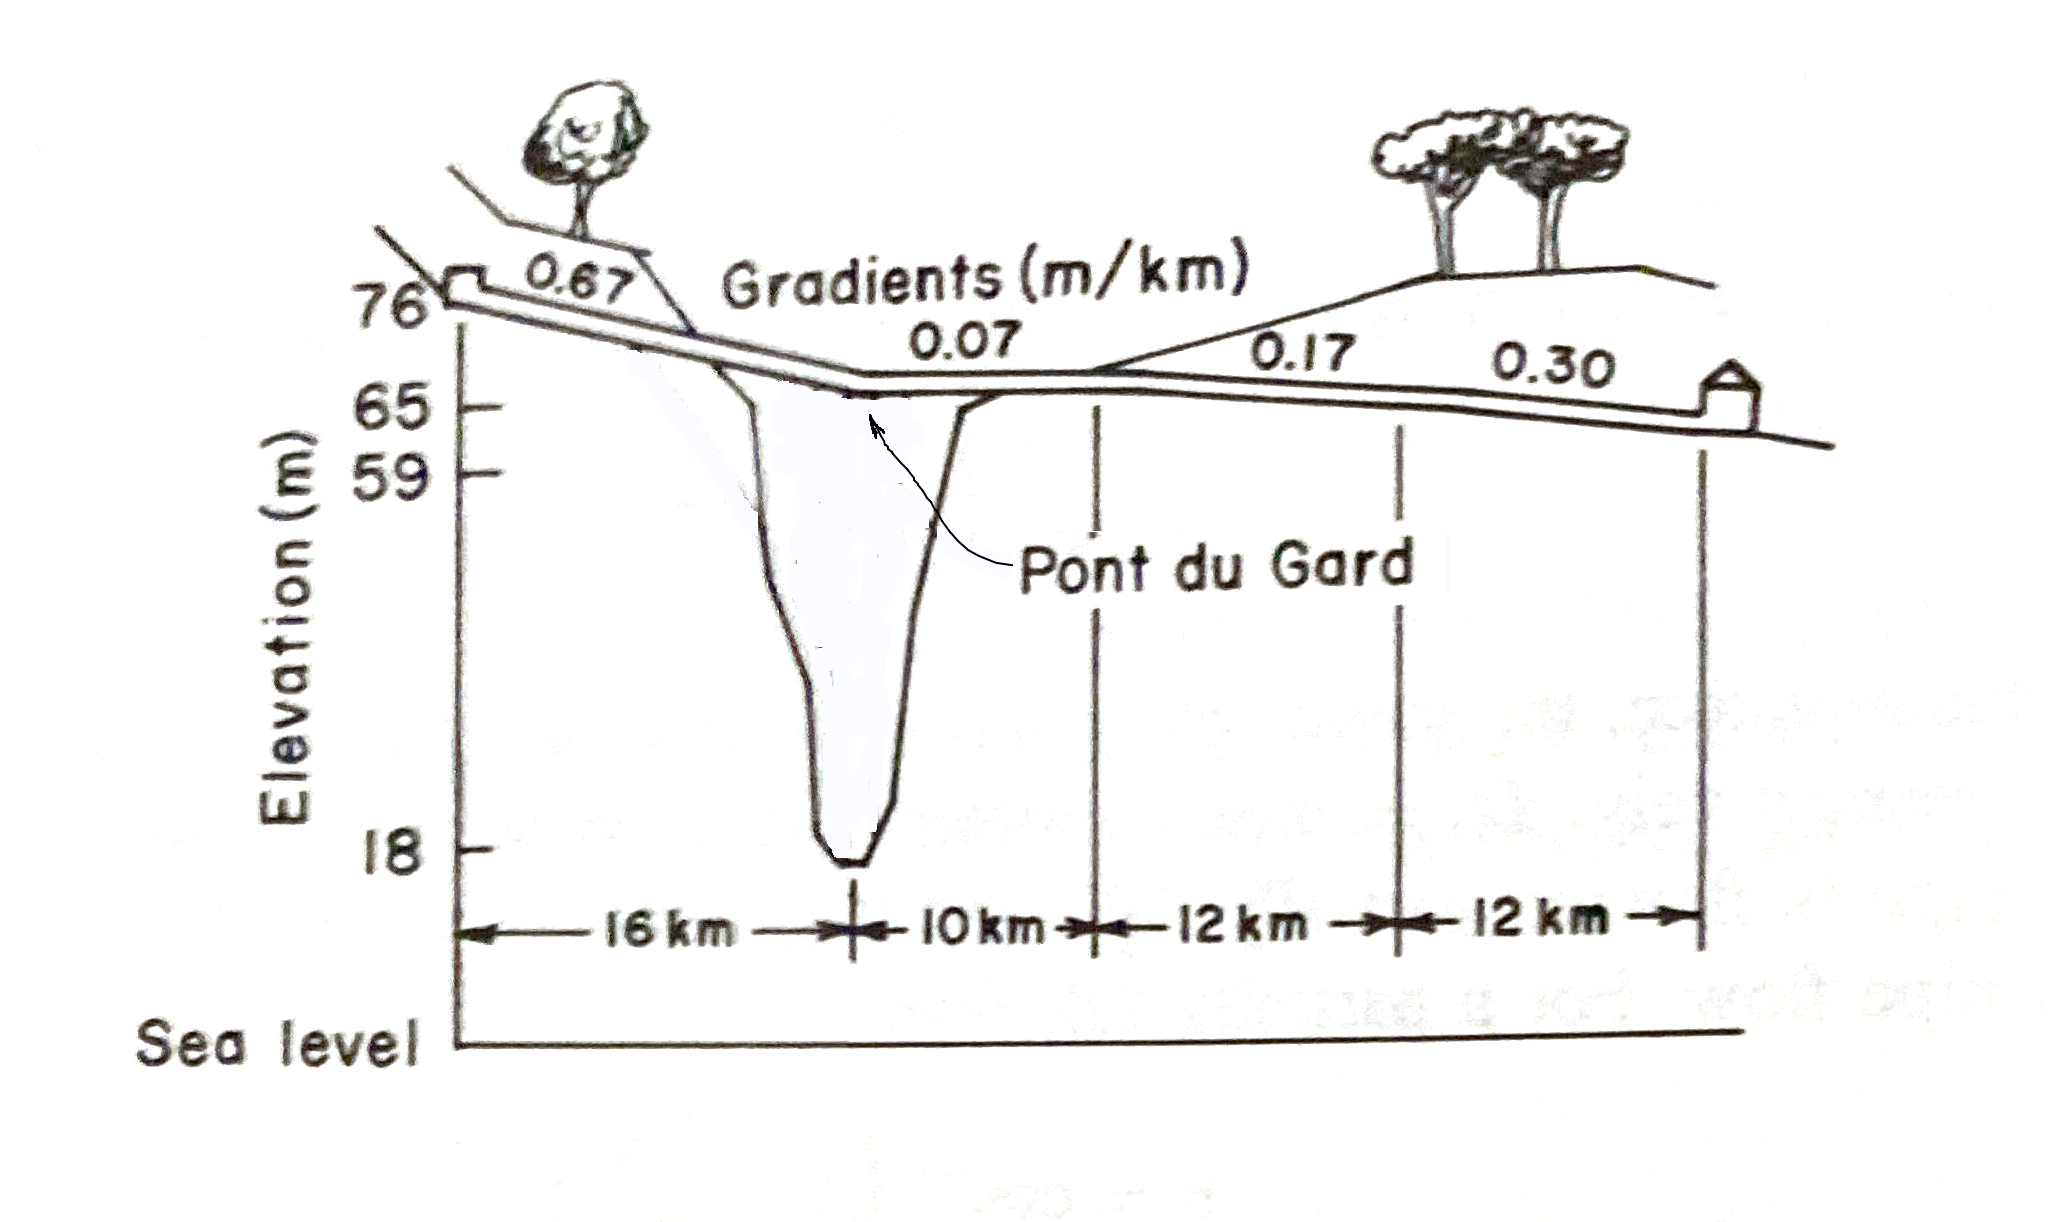
Figure 6.3 is an elevation view sketch of the aquaduct showing the relative positions of the origin and terminus of the feature, profile grades (bottom slopes) and approximate land surface elevation and aquedict elevations (in meters). The Pont du Gard bridge begins roughly at the slope change from 0.67 to 0.07.

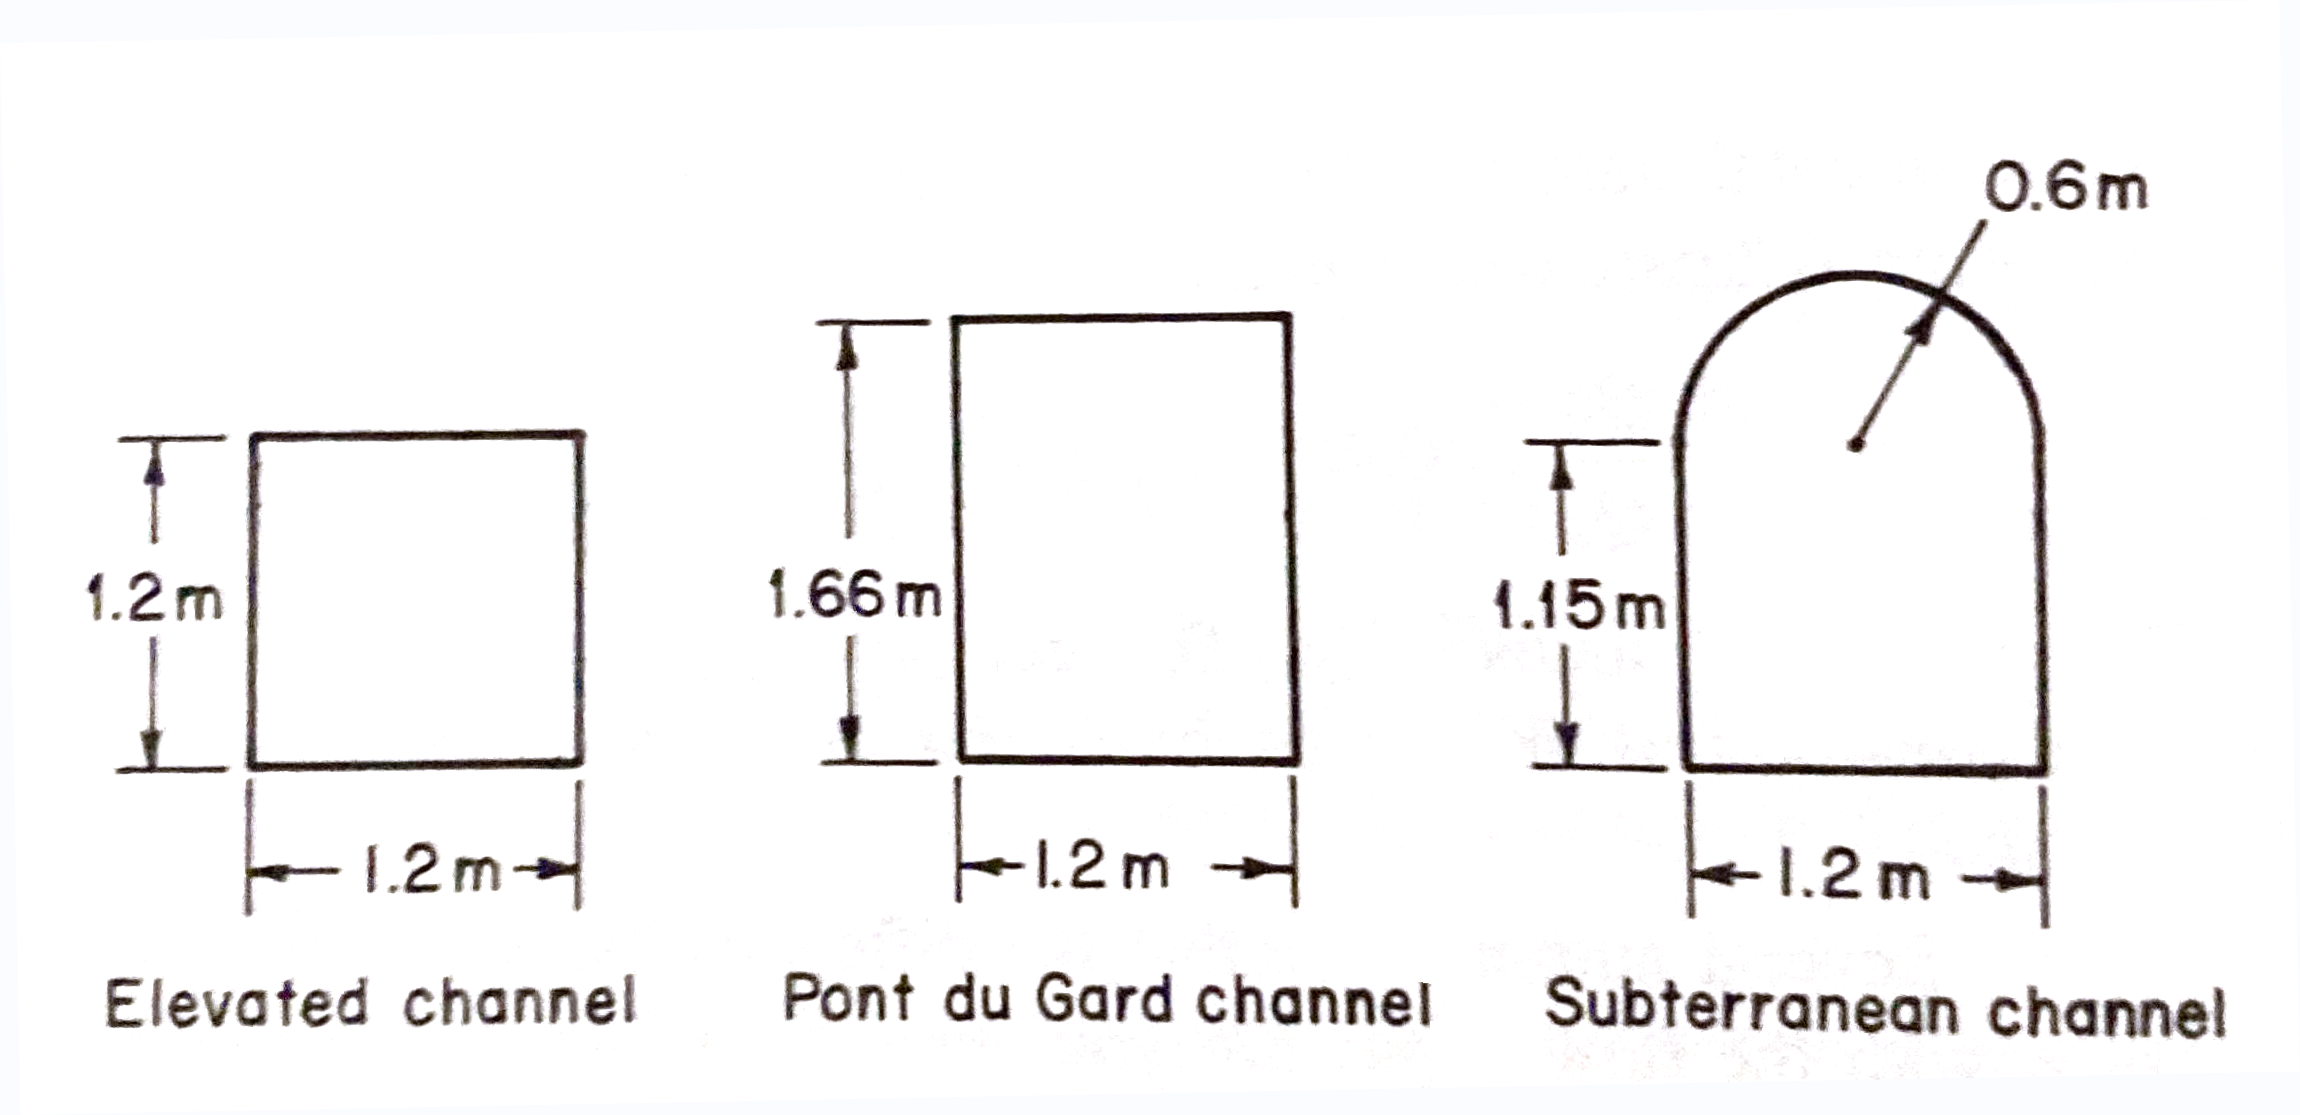
The various channel cross sections are shown in Figure 6.4. The "subterranean channel" portion is roughly the 24 kilometer section terminating at Nimes. The portion upstream of the Pont du Gard crossing is represented by the "elevated channel" cross section drawing, whereas the "Pont du Gard channel" represents the middle 10 kilometer porton of the aqueduct.

Assuming Manning's $n=0.0125$ for all the channel portions, compute the normal depth in different segments for flows ranging from 100 to 450 liters per second in 25 lps increments, and complete the table below.
| Discharge (lps) | Elevated Section ($S_0=0.67$) | Pont du Gard Section ($S_0=0.07$) | Subterranean Section ($S_0=0.17$) | Subterranean Section ($S_0=0.30$) |
|---|---|---|---|---|
| 100 | ||||
| 125 | ||||
| 150 | ||||
| 175 | ||||
| 200 | ||||
| 225 | ||||
| 250 | ||||
| 275 | ||||
| 300 | ||||
| 325 | ||||
| 350 | ||||
| 375 | ||||
| 400 | ||||
| 425 | ||||
| 450 |
- Does the aqueduct appear to be able to safely convey the largest discharge?
- What is the minimum freeboard (distance from water surface to top of conduit) in the system at the largest discharge?
- Where does the minimum occur?