Download this file as a Jupyter Notebook@ http://54.243.252.9/ce-3372-webroot/2-Exercises/ES8/ES8.ipynb
ES-8
Copyright © 2021 Theodore G. Cleveland
Purpose:
Application of EPANET for analysis of pressure and flow in the SomewhereUSA water distribution systems.
Purpose:
- Compute flow distribution in pipeline networks.
- Use professional software (EPANET)
- Develop expertise in interpreting output to answer specific hydraulic questions
Background
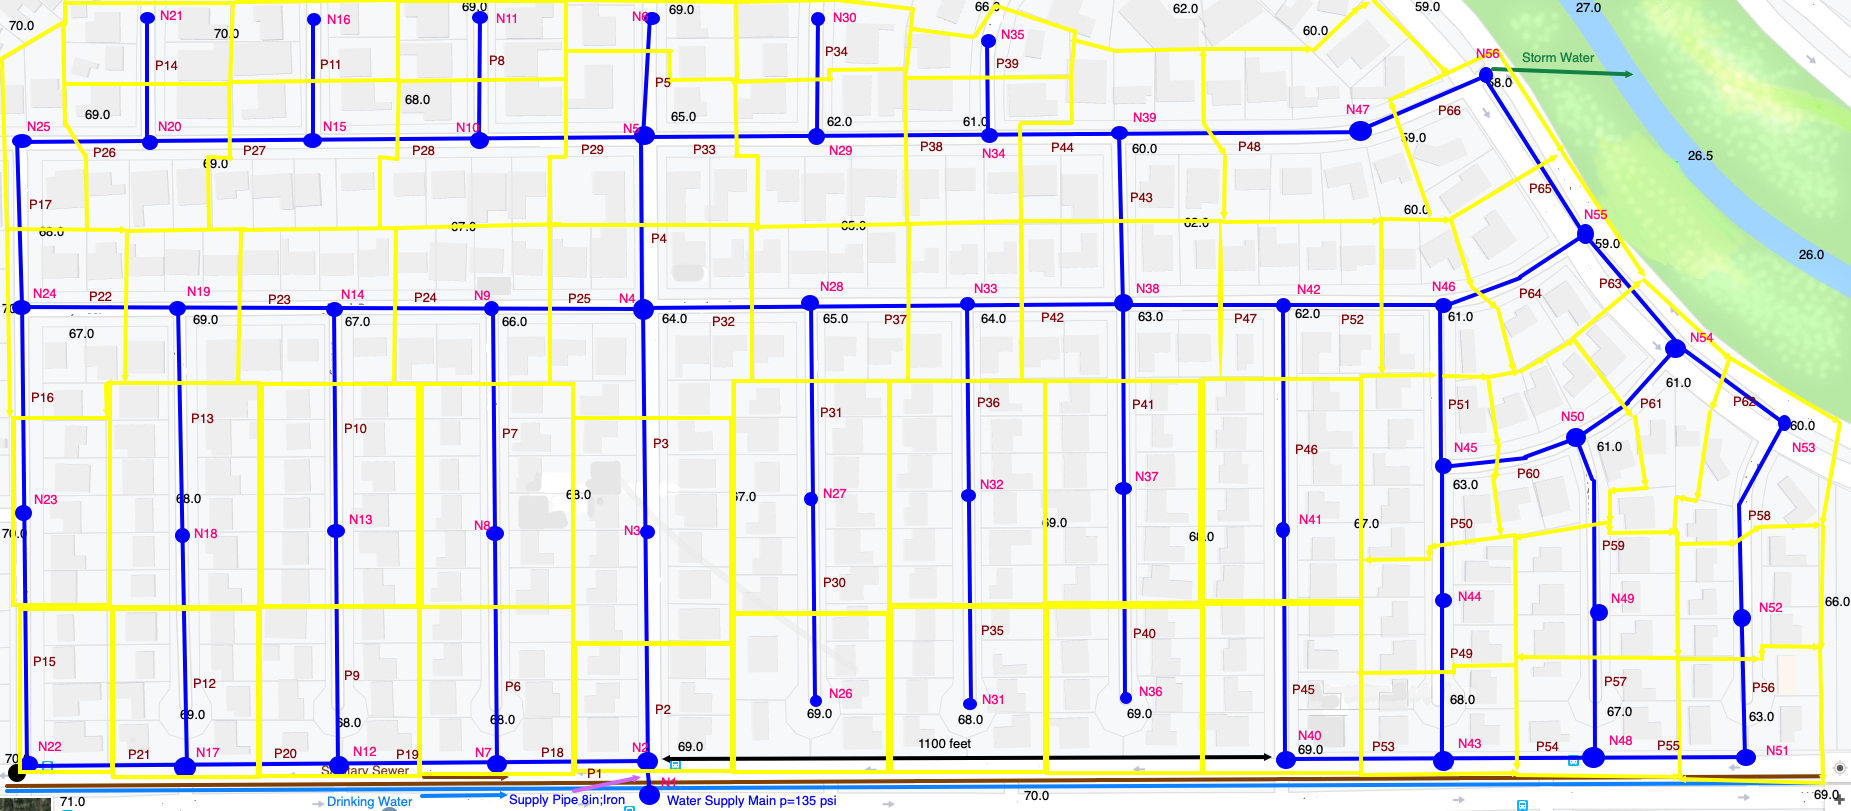
The figure is a layout of a water distribution system for the SomewhereUSA subdivision. The blue line segments are pipes (ductile iron) and are labeled (P1, P2, . . . ). The blue circles are nodes and are labeled (N1, N2, . . . ). The yellow polygons represent the demand lots assigned to each node. For example, node N2 supplies the six (6) individual lots located near the node.

The distribution system is connected to the supply main at node N1. This large water main supplies water at 135 psi. pressure. The pipe connecting node N1 to N2 is an 8-inch diameter, ductile iron pipe. The remaining pipes are 2-inch diameter, ductile iron pipe.
The system is to be modeled using the United States Environmental Protection Agency, EPANET hydraulic and water quality simulator. Use RG-195 and the San Marcos Texas manual for statutory requirements as necessary:
Exercise Part 1
- Using the naming convention in the drawings, determine the individual pipe lengths and produce a table of pipe length, and diameter by pipe ID. Include this table in your solution report;
- Produce a land surface elevation map; include the map in your solution report (you did this in an earlier exercise, you can reuse your map and need not create a new one;
- Using the naming convention in the drawings, determine the individual node elevations (offset as necessary to ensure the pipe network is buried a sufficient depth throughout the subdivision) and produce a table of node elevation by node ID;
Exercise Part 2
Build an EPANET model, using the Hazen-Williams head loss model of the network. Using the model:
- Make a screen capture of the EPANET program showing your network map, with the Node ID and Node Pressures displayed on the map, and with the Pipe ID and Pipe Flow Rates on the map.
- Determine magnitude and location of minimum pressure in the system at average demand (reuse your earlier exercise solutions);
- Determine magnitude and location of minimum pressure in the system at peak demand;
- Determine magnitude and location of maximum pressure in the system at average demand;
- Determine magnitude and location of maximum pressure in the system at peak demand;
- Determine if there are low-pressure portions of the system that need to be mitigated by changing pipe diameters, if so, adjust the diameters and present the adjusted design as a second, independent simulation;
- Apply a demand pattern multiplier and simulate time-varying behavior in the distribution system;
Deliverables:
A brief report with your solution, showing the requested screen captures, tables and head loss calculations. The report should contain complete citations to external sources used to for statuatory requirements, loss coefficients, hydrant locations, etc.
References
- Rossman, L. (2000). EPANET 2 users manual. Technical Report EPA/600/R-00/057,U.S. Environmental Protection Agency, National Risk Management Research LaboratoryCincinnati, OH 45268.
