Download this file as a Jupyter Notebook@ ES15.ipynb
ES-15
Copyright © 2022 Theodore G. Cleveland
Purpose:
Demonstrate application of SWMM for analysis of a storm drainage system.
Objectives:
- Apply results of prior exercise for input hydraulic model testing in SWMM
- Interpret SWMM output and verify original design or make changes based on results and demonstrate design accomodates anticipated design conditions
Problem Statement (Repeated from prior exercise)
Figure 1 is an older (circa 1993) aerial image of a portion of Houston, Texas. The red polygon is the drainage boundary for a storm sewer system that drains North from the part of the area near Westheimer Road to a tributary of Buffalo Bayou and East from the area. The drainage ditch is shown as the “blue” fuzzy line on the figure.

Drainage in the ditch is from West to East. The two main streets in the study area are highlighted in magenta.
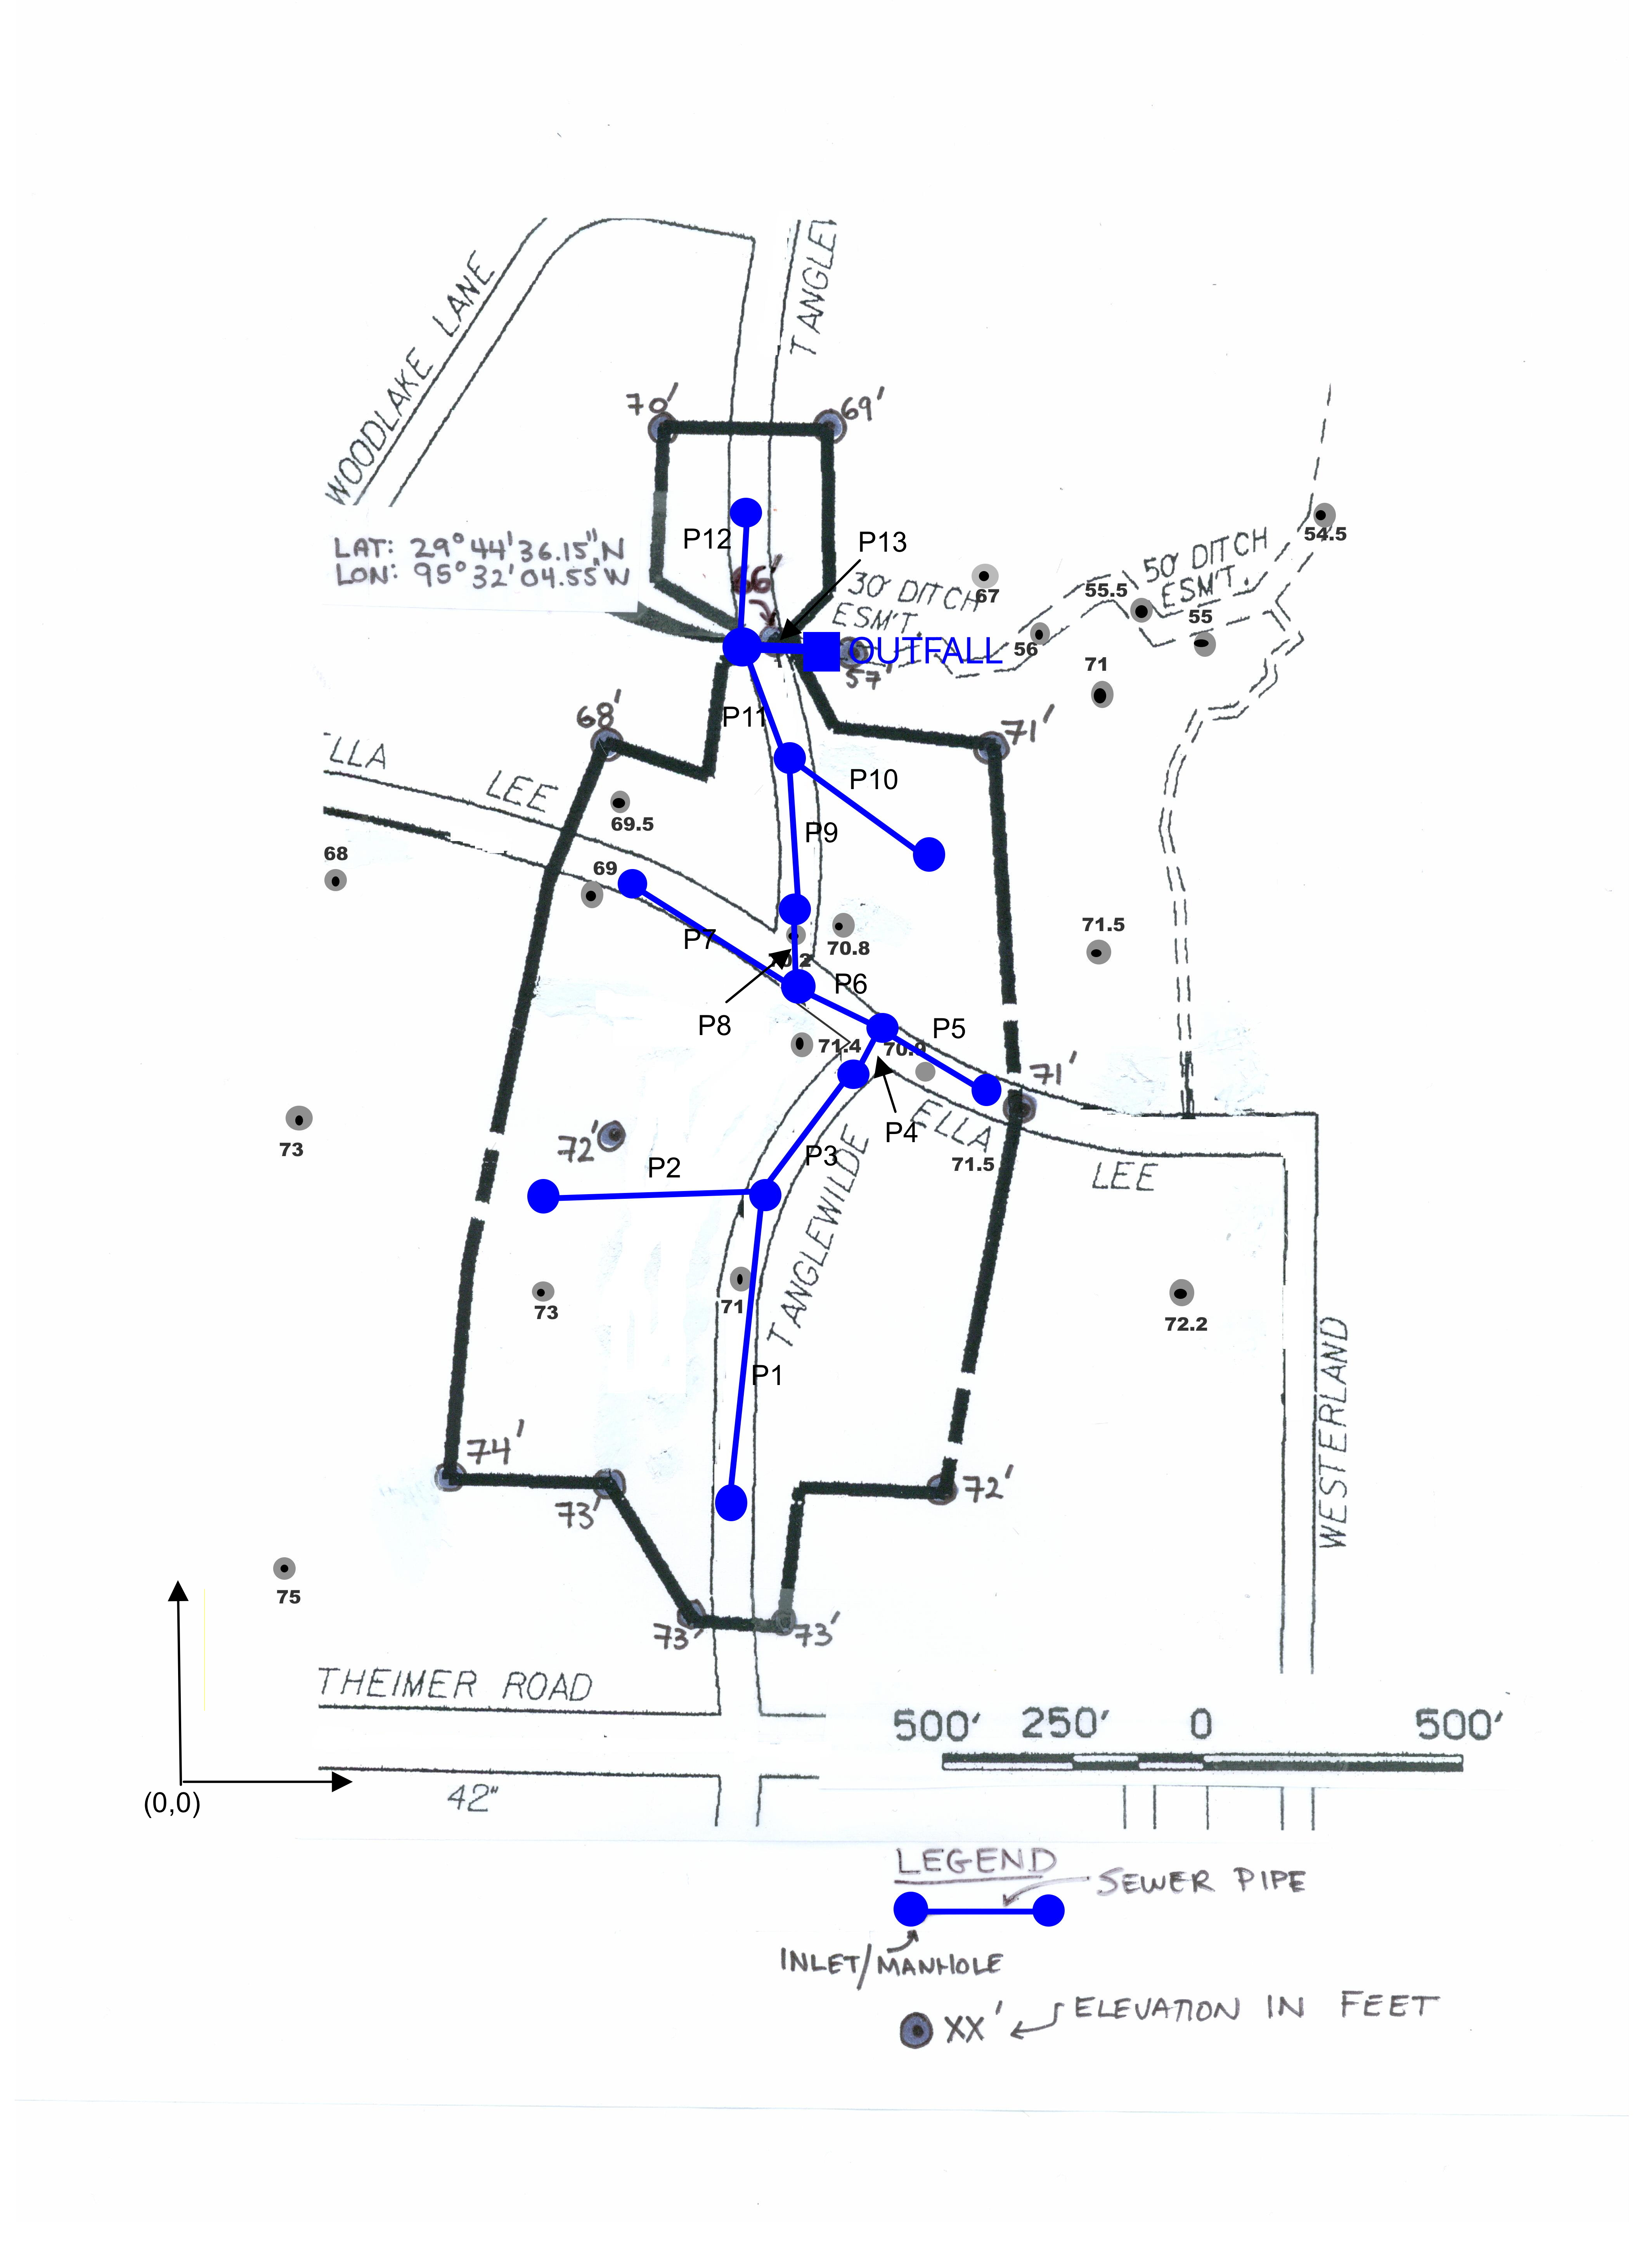
Figure 2 is a map showing storm drainage alignments and inlets location.

Using the results from the prior exercise (ES-13) build a SWMM model of the drainage system and demonstrate the system will accomodate a 5-year, 3-hour storm in Harris County, Texas.
Modify the design as needed to prevent surcharge in the drainage system. Treat the outfall as a fixed stage outfall.
Deliverables
A brief report with your solution, showing the requested simulations, tables discharge and depth calculations.
References
- Rossman, L. (2009). Storm Water Management Model user’s manual version 5.0. Technical Report
EPA/600/R-05/040, U.S. Environmental Protection Agency, National Risk Management Research Laboratory Cincinnati, OH 45268
